Exponential Decay functions model many real world scenarios. Probably the most well known example of exponential decay in the real world involves the half-life of radioactive substances
Example
of Equation & Graph of Exponential Decay Function
- Property #1) rate of decay starts great and decreases ( Read on, to learn more about this property, which is the primary focus of this web page)
-
Property #2) The domain is
all real numbers . $$ \{x: x \in \mathbb{R}\} $$
-
Property #3) The range is
all positive real numbers greater than 0 .$$ \{ y: y > 0 \} $$
- Property #4) It is a one-to-one function
- Property #5) The graph is asymptotic with
-
Property #6) The value of 'b' in the general equation must be
less than 1
-
Property #7) The inverse of exponential decay is
a logarithmic functions.
Of note: Exponential Growth is not the inverse of exponential decay.
General Formula for Equation
of Exponential Decay
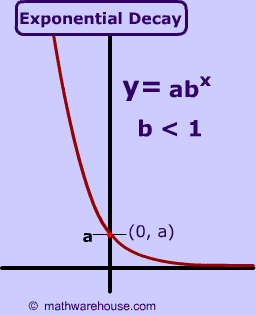
In this example, 'a' stands for the initial amount, and 'b' is any real number that is less than 1.
The graph's asymptote at x -axis .
When B is greater than 1 , you are not dealing with exponential decay but rather exponential growth (Exponential Growth Lesson ).
What about when b is exactly equal to 1 ?
In this case, you are not dealing with an exponential equation, but rather a linear equation.(Link)
$ y = ab^x \\ y = a(1)^x \\ y = a $As you can see from the work above, and the graph, when b is 1, you end up with the equation of a horizontal line. ( Link )
The Graph
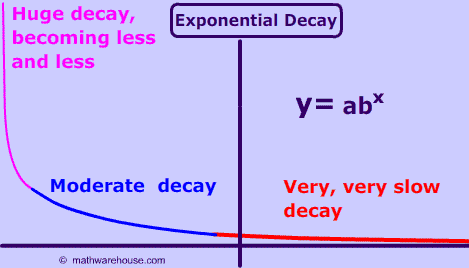
Property #1) Rate of decay of exponential decay decreases , becoming less and less as the graph approaches the x-axis. (but never actually touches the x-axis) !
As the graph on the left shows, at first, exponential really decreases greatly, but the rate of decay of becomes less and less until the becomes almost nothing.
Table of Values
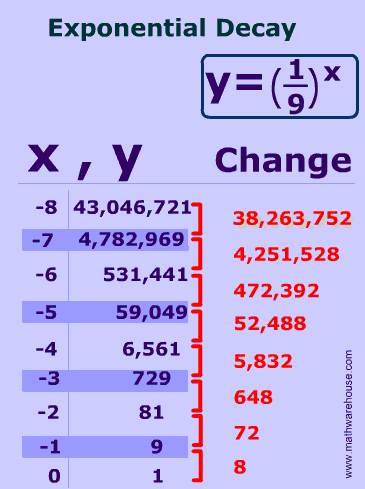
The table of values for the exponential decay equation $$y = \big( \frac 1 9 \big) ^x $$ demonstrates the same property as the graph. The rate of decay is great at first
Let's look at some values between $$ x=-8$$ and $$ x = 0$$.
At first, between x = -7 and x = -8, the value of the function changes by more than 38 MILLION! --the rate of decay is HUGE!
But the rate of decay becomes less and less. Between x = -7 and x = -6, the function decays by a little over 4 million.
Role of 'a'
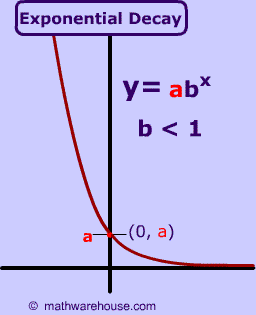
For $$y = \color{red}{a} \cdot b^x $$ , a determines the y-intercept.
Typically, in real world scenarios like half life this y-intercept is the 'starting amount' of the substance or thing that is decaying.
Problem 1
What is the graph of the following exponential decay function? 
Problem 2
What is the graph of the exponential decay function below? 


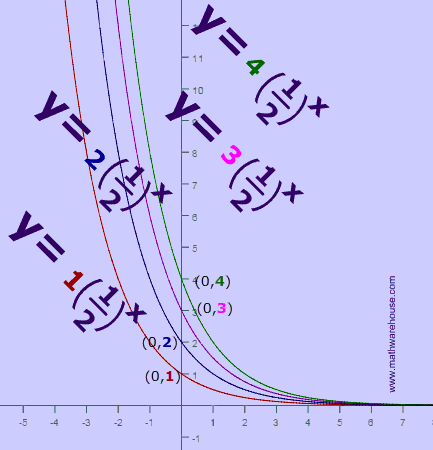
Graphs of Exponential Decay Functions and Equations
Below you can compare the graphs for three different exponential decay equations