Mathwarehouse Logo

Radioactive Half Life

Exponential Decay of Radioactive and Other Substances

Radioactive Decay Overview

picture of half life of a radioactive substance

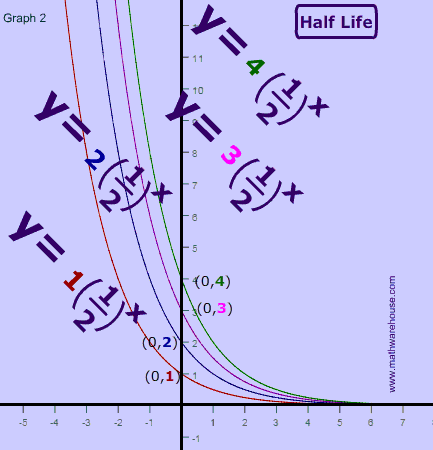
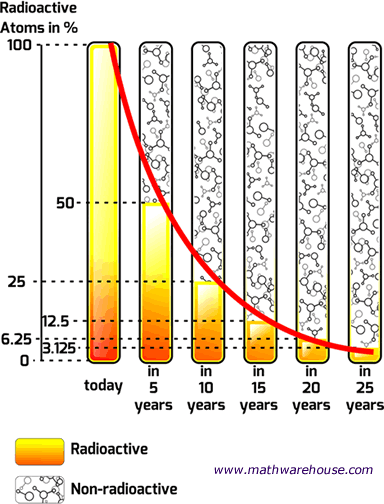
In this first chart, we have a radioactive substance with a half life of 5 years. As you can see, the substance initially has 100% of its atoms, but after its first half life (5 years) only 50% of the radioactive atoms are left.

That's what 'half life' means. Literally, half of the substance is gone every five years (the half life of this particular substance).

So, in our example , after the second life is over (that's 10 years since each half life is 5 years), there will be $$\frac 1 2$$ of $$ 50\% $$ of the substance left, which, of course is $$ 25 \% $$.

And the pattern continues, every 5 years another half life reduces the substance by $$ \frac 1 2 $$, so after the the third life is over ( the 15 year mark), there will be $$\frac 1 2 $$ of $$ 25\% $$ of the substance left , which is $$ 12.5 \% $$.

General Formula

General Formula: Starting Amount

Real World Example --- Iodine -131

Iodine-131 is a radioactive substance and has a pretty short half life of only 8 days. Graph 3, below, represents the graph of its half life.

Picture of Exponential Decay function example

If 30 grams is given to a patient, then, how much of the substance is left after 8 days?

Since 8 days is 1 half life, we just multiply the starting amount by $$ \frac 1 2 $$

$$ \text{30 grams} \cdot \frac 1 2 = \text{ 15 grams } $$

You can see, on Graph 3, that 1 half life is the point (1,15).

How much is left after 16 days?

Since 16 days is 2 half lives, we just mulitply, the last value of 15 by $$ \frac 1 2 $$ to get 7.5

What does half life mean on a graph?

what does half life mean

Well, if the half life is '3 years' how does that relate to the graph?

What if the half life is '4 minutes' ?

In short, the half life tells us the scale of the graph.

If the half life is '3 years', then each tick mark on the graph represents 3 years.

On the other hand, if the half life is '4 minutes', then each tick mark on the graph represents 4 minutes .

Back to Exponential Decay