Math Gifs
Algebra
Geometry
Trigonometry
Calculus
Teacher Tools
Learn to Code
Calculator
Home
Geometry
Parabola
Parabola Graph and Equation
Resources, links, and applets
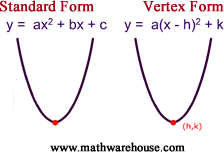
Standard And Vertex Form
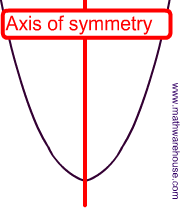
Axis of Symmetry
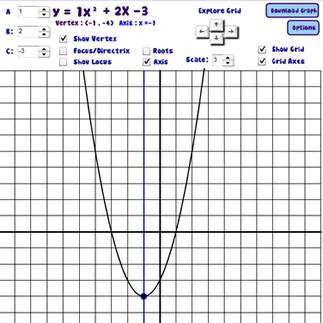
Parabola Graph Maker
Graph any parabola and save its graph as an image to your computer
Focus and Directrix of Parabola
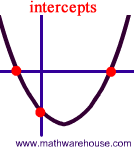
Intercepts of Parabola
Vertex of a Parabola
Real World Applications
Converting Standard And Vertex Forms
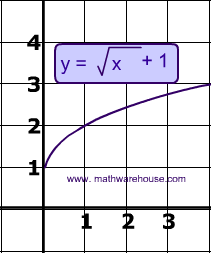
Square Root Function
Inverse of a parabola