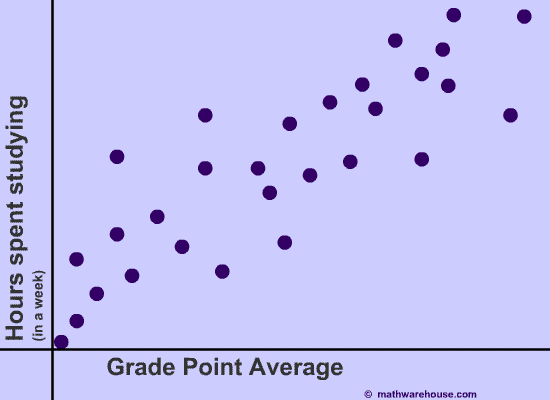
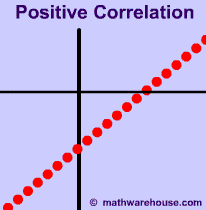
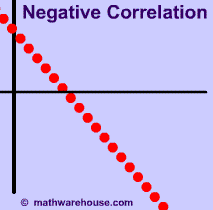
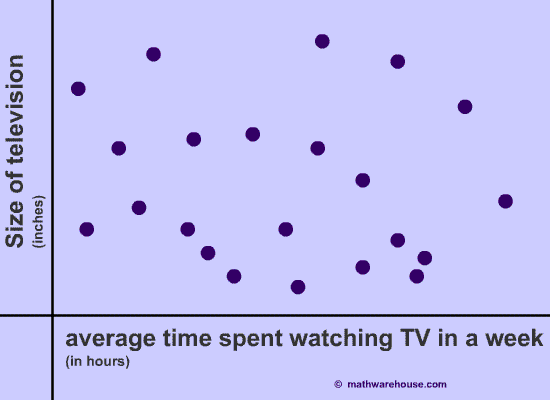
The three scatter plot graphs below represent example of data with different correlation coefficients. One of the graphs demonstrates a positive correlation coefficient. The other graph has a negative correlation coefficient, and one of the graphs has no correlation between the two variables at all. Can you identify which graph goes with which type of correlation coefficient?

Examples of positive and negative correlation coefficients
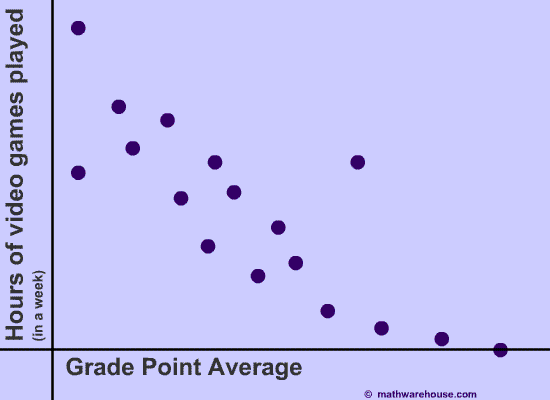
Below is a more realistic example of a negative correlation (Note: the data below is completely made up. I have no idea if playing video games has any correlation to grade point average!)
Below is a more realistic example of a positive correlation (Note: the data below is completely made up. I have no idea if the correlation between studying and gpa exists!)
