Interactive Linear Inequality
Click and drag the points on the inequality below and the graph, formula and equation will adjust accordingly. (Try clicking on equation itself to toggle between ≤, <, > and ≥)
Try the full sized interactive linear inequalityUse it to enable or disable snapping
Click on the equation to change inequality type between ≤, <, > and ≥
You can drag the points to change the line equation
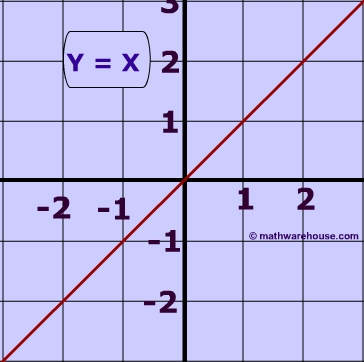
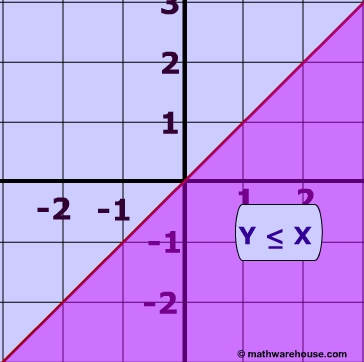
Examine the 3 graphs below to understand how linear inqualities relate to a linear equation.
Examine the 3 graphs below to understand how linear inqualities relate to a linear equation.
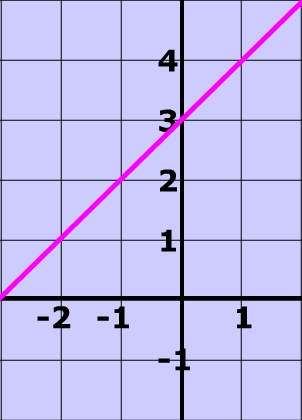
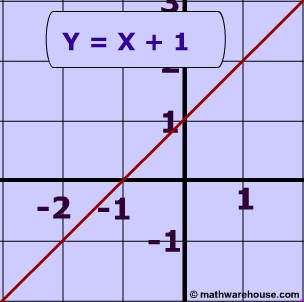
Below is the graph of the equation of the line $$ y = x + 1 $$.
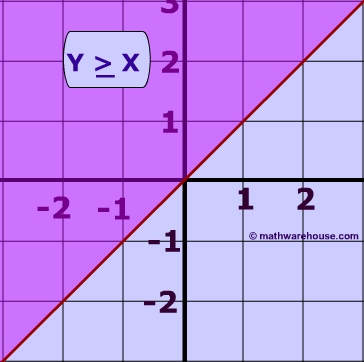
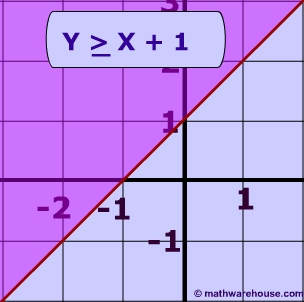
The equation of $$ y ≥ x + 1 $$.
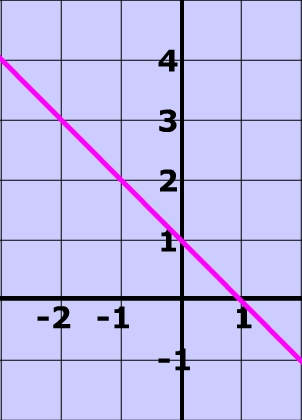
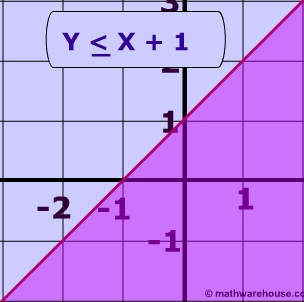
The equation of $$ y ≤ x + 1 $$.
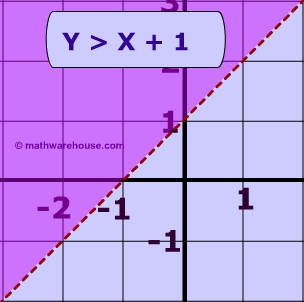
The graph of $$ y > x + 1 $$.
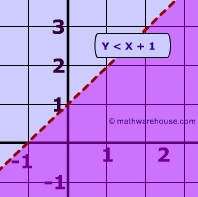
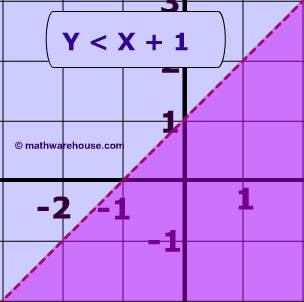
The Graph of $$ y < x + 1 $$.
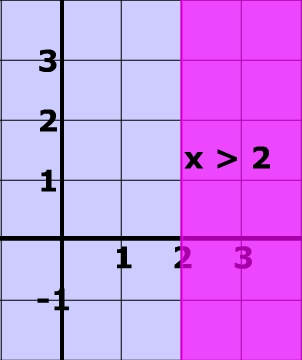
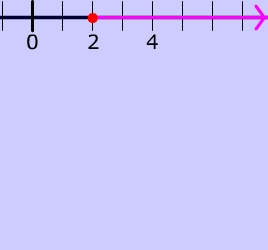
Below is the graph of $$ x> 2 $$ on the number line.
Below is the graph of the linear inequality $$ x >2 $$ on the coordinate plane.