
Demonstration of Hyperbola Graph
A hyperbola is a type of conic section that looks somewhat like a letter x. A hyperbola is a set of all points P such that the difference between the distances from P to the foci, F1 and F2, are a constant K. Before learning how to graph a hyperbola from its equation, get familiar with the vocabulary words and diagrams below.
Definitions
of Important terms in the graph & formula of a hyperbola
- focus of hyperbola : the two points on the transverse axis. These points are what controls the entire shape of the hyperbola since the hyperbola's graph is made up of all points, P, such that the distance between P and the two foci are equal. To determine the foci you can use the formula: a2 + b2 = c2
- transverse axis: this is the axis on which the two foci are.
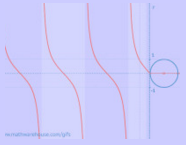
- asymptotes: the two lines that the hyperbolas come closer and closer to touching. The asymptotes are colored red in the graphs below and the equation of the asymptotes is always:
Picture
of hyperbola with a vertical transverse axis
Comparison
of graphs of Hyperbolas & Equations