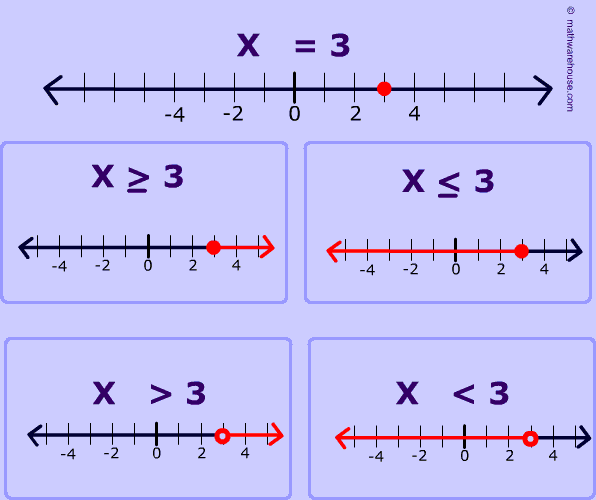
Graphing an inequality on a number line, is very similar to graphing a number. For instance, look at the top number line x = 3. We just put a little dot where the '3' is, right?
Now an inequality uses a greater than, less than symbol, and all that we have to do to graph an inequality is find the the number, '3' in this case and color in everything above or below it.
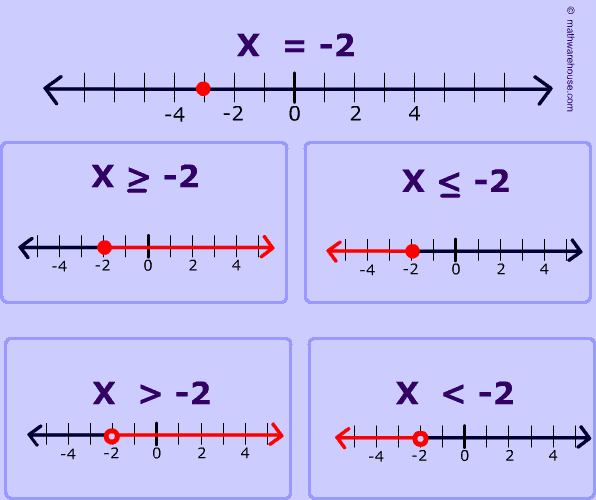
Just remember- if the symbol is (≥ or ≤) then you fill in the dot, like the top two examples in the graph below
- if the symbol is (> or <) then you do not fill in the dot like the bottom two examples in the graph below
To better understand how to graph inequalities, look at the examples below or experiment with the grapher that is immediately below.
Examples
Example 1
Example 2
This Page:
Related: