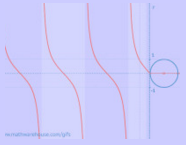
It is often very difficult for students to interpret and understand graphs that display the distance between two object over time.
A distance vs time graph measures how far two objects are from each other. Often these graphs are used to show the journey that someone makes from home to school and back etc.. The interactive app below allows you to make your own distance vs time graph!
A distance vs time graph measures how far two objects are from each other. Often these graphs are used to show the journey that someone makes from home to school and back etc.. The interactive app below allows you to make your own distance vs time graph!

