Sample Bar Graph
Discussion/Introduction
You can download this lesson plan as a pdf
After weeks and weeks of arithmetic and mental math that tax my students’ minds to the utmost, I always enjoy getting to the graph section of our curriculum. It’s a breather, almost, and the change of pace is very welcome. At the same time, our unit on graphing is a very important one—as students enjoy making colorful charts and graphs they learn how to condense real-world data into a mathematical format that is easy to understand, concise, and easy to analyze.
A 2nd grade bar chart lesson can be just complex enough to be exciting, but there’s no need to go into the complicated situations that will leave your students scratching their heads in confusion. The free chart-maker at Meta-Chart (http://www.meta-chart.com/) is a wonderfully easy way to make professional, streamlined charts and graphs; all you do is plug in your data and—eureka!—out comes the graph.
Objective
Students will learn how to analyze data on a simple single-unit bar chart with four categories. They will learn to solve simple put-together, take-apart, and compare problems using information presented in a bar graph by making use of a free online bar graph maker.
Supplies
- A mug with around 20-30 colored M&Ms, and ~8 M&Ms for each child in the bag
- 1 sheet of graph paper for each child
- Markers
- Graph printouts from http://www.meta-chart.com/bar (or, if you have projector capabilities, meta-chart graphs prepared and saved on your laptop).
Methodology/Procedure
When students are investigators what they learn becomes part of them. Bar graphs lend themselves well to a discovery way of teaching because they are, in a way, a special code that can be discovered. Your students will have had some exposure to graphs in grade 1; some will have even done very basic work with bar graphs. They have all the tools they need to figure out what the bar graph is telling them if you give them the time and encouragement to figure it out by themselves.
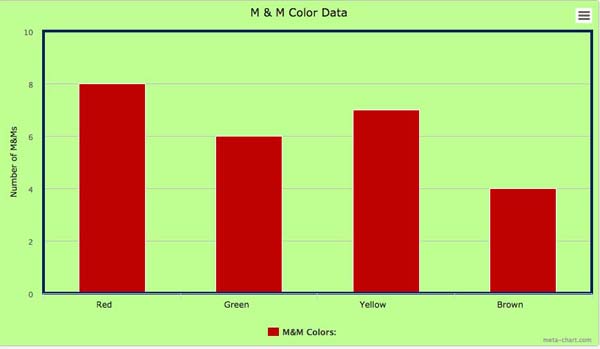
Teacher: Look, I have a mug here with M&Ms in it. You can’t look inside right now, but here is a graph that tells you what the colors of the M&Ms are.
[Give students a chance to look at it and think about what it is saying.]
Teacher: Can anyone tell me which color I have the most of?
Student: Red!
Teacher: Yes! You are correct. How did you know?
Student: The bar labeled red is the longest.
Teacher: You’re right. Can you tell me how many red M&Ms there are in my cup?
If a student gives the right answer, applaud him and ask for an explanation why. If no-one knows, ask some more leading questions.
Teacher: How long is the red M&M bar? Is there a number which tells how long it is? What do you think that number might be telling us?
Once the students have figured out how many red M&Ms there are, reinforce that interpretative ability by asking questions about the other colored M&Ms in the mug. Then go on to problems related comparing.
Teacher: How many more red M&Ms do I have than blue?
Lead the students to discover that they can find the difference without doing subtraction by simply noticing how much further the red line sticks out. Ask questions comparing each of the other lines.
When your students are comfortable comparing, go on to simple put-together and take-apart problems using the data on the graph.
Teacher: If I don’t like red or green M&Ms and decide to throw those ones away, how many will I throw away?
Given the opportunity to discuss and brainstorm, your students should have no trouble solving this. If their thinking was anything less than automatic, follow this up with a similar question. If your dog only can eat yellow or brown M&Ms, how many will he have? Then ask a take-apart question:
If I actually like green M&Ms and want to have as many green M&Ms as red, how many more green M&Ms do I need to put in the mug?
Once the students are comfortable doing a variety of problems, have them each draw two axis on their own graph paper, and label the vertical axis with numbers 1-6. Distribute around eight M&Ms to each child, and have them draw a bar graph. They can color each bar the bars the same color as the M&Ms for easy labeling. Post the graphs at the front of the room, and discuss which child has the most red, the most green, the most yellow, and so on.
Evaluation
You’ll be able to tell how well the students understood the concept of a bar graph by how much help and hand-holding they need when it comes to drawing their own graphs. Quick comparing and put-together questions on the smaller numbers of their own M&M collections and graphs will give you another way of testing their ability to understand the logic behind bar graphs.
A Single Unit Bar Chart Lesson in Your Classroom
If you use my lesson plan I’d love to hear from you regarding your experiences—did you have fun with your students? What is your preferred way of teaching a 2nd grade bar chart lesson? Please comment!
 Download this lesson
 Common Core Standards
The Common Core recognizes the importance of learning how to use graphs for data representation and manipulation in the early grades. For second grade, under measurement and data [ 2.MD.10 ], the Common Core State Standards for Mathematics reads ‘Draw a picture graph and a bar graph (with single-unit scale) to represent a data set with up to four categories. Solve simple put- together, take-apart, and compare problems using information presented in a bar graph.’
Web Resources/Further Exploration
The chart maker at http://www.meta-chart.com is a convenient, easy to use, free way of preparing charts or graphs for any of your classes!