Vertical Translations of Sine and Cosine graphs
Example
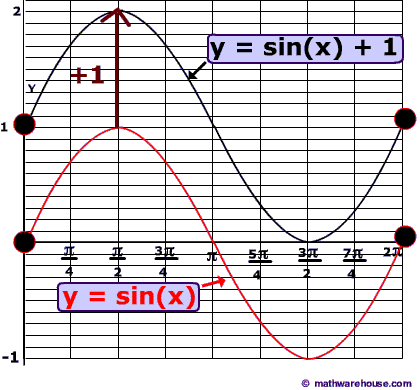
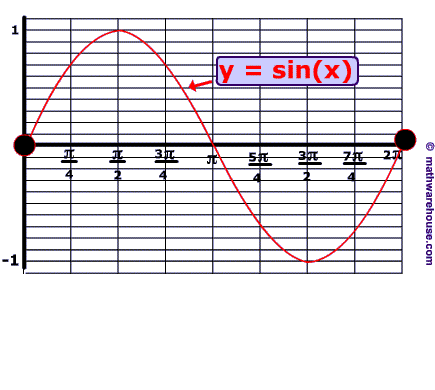
If you're on this web page, you should be very familiar with the graph of y =sin(x) as shown below $$ 0 \le x \le 2 \pi $$. An example of first type of translation that we wil look at is y = sin(x) + 1.
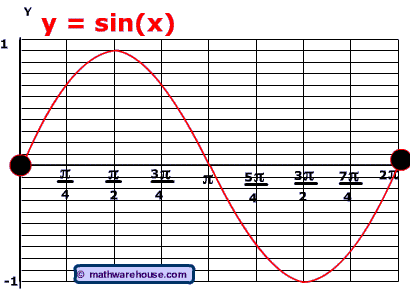
Below you can see both the original graph of y =sin(x) and the graph of the translation y = sin(x) + 1.
Problem 1
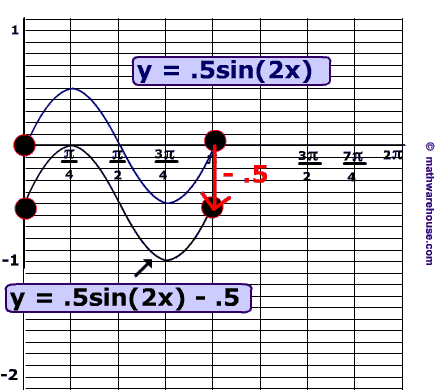
This translation expresses a vertical shift downwards by 1.
Problem 2
Problem 3
Graph of f(x) = sin (-x) is the reflection of the graph of f(x) = sin (x) about x-axis.
Each pair of corresponding points on the graphs has the same distance form the x-axis.
For example, points A and B are two corresponding points on the graphs, and they are at the same distance from the x-axis. That is, AM = BM.
_sin(-x).png)
Problem 4
The difference between the variables of the two functions is:
$$\left(x+\frac{5\pi}{4} \right)-\left(x+\frac{\pi}{4} \right)$$
= $$x+\frac{5\pi}{4} -x-\frac{\pi}{4}$$
= $$\frac{5\pi}{4} -\frac{\pi}{4}$$
= $$\frac{4\pi}{4}$$
= $$\pi$$
So, the graph of f(x) is transferred $$\pi $$ units to the left to create the graph of g(x).
_sin(a+pi).png)
Problem 5
The difference between the variables of the two functions is:
$$\left(3x+\frac{\pi}{3} \right)-\left(3x-\frac{\pi}{3} \right)$$
= $$3x+\frac{\pi}{3} -3x+\frac{\pi}{3}$$
= $$\frac{\pi}{3} +\frac{\pi}{3}$$
= $$\frac{2\pi}{3}$$
Therefore, the graph of f(x) is transferred $$\frac{2\pi}{3} $$ units to the left to generate the graph of g (x)
_sin(a+2pi).png)
Problem 6
_sin(-a)-b_1.png)
Difference between the values of f(x) and g(x) is -3. Therefore, g(x) is obtained by moving f(x) 2 units downward.
Problem 7
First graph of $$f(x)=\sin (x)$$ is transferred to the graph of $$h(x)=\sin (x+2)$$ by moving 2 units to the left as shown in the graph below.
_sin(a)+b_1.png)
Then the graph of g(x) is obtained by moving the graph of h(x) upward 2 units.
_sin(a)+b_2.png)
Problem 8
Graph of cos (-x) is exactly the same as the graph of cos (x).
So, g(x) is exactly the reflection of f(x) about x-axis.
.png)
Problem 9
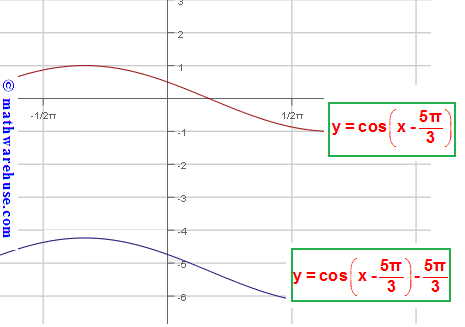
$$g(x)-f(x)=\left[\cos \left(x-\frac{5\pi}{3} \right)-\frac{5\pi}{3} \right] - \cos \left(x-\frac{5\pi}{3} \right)$$
= $$\cos \left(x-\frac{5\pi}{3} \right)-\frac{5\pi}{3} -\cos \left(x-\frac{5\pi}{3} \right)$$
= $$-\frac{5\pi}{3} $$
So, the graph of f(x) is moved $$\frac{5\pi}{3} $$ units downward to generate the graph of g(x).
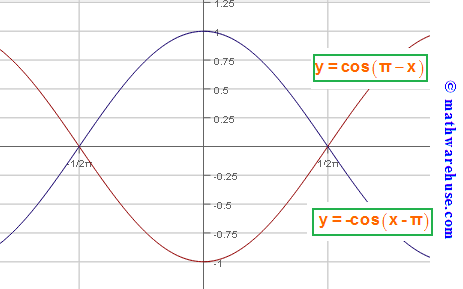
Problem 10
$$f(x)=\cos \left(\pi -x\right)$$ is the same as $$f(x)=\cos \left(x-\pi \right)$$. So $$g(x)=-\cos \left(x-\pi \right)$$ is the reflection of f(x) about x-axis.
Problem 11
$$g(x)=\cos \left(\frac{\pi}{3} \, \, -\, \, x\right)\, \, -\, \, \frac{\pi}{3} $$ is the same as $$g(x)=\cos \left(x-\frac{\pi}{3} \, \, \right)\, \, -\, \, \frac{\pi}{3} $$.
So, f(x) is moved downward $$\frac{\pi}{3} $$ units.
_shift_down.png)
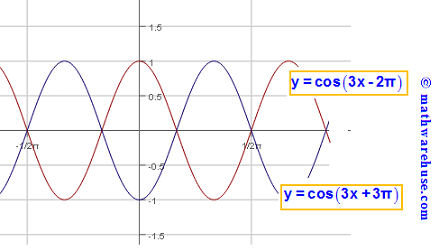
Problem 12
$$(3x+3\pi)-(3x-2\pi)$$
= $$3x+2\pi -3x+3\pi$$
= $$2\pi +3\pi$$
= $$5\pi$$
So, the graph of f(x) moved $$5\pi $$ units to the left in order to generate the graph of g(x).