Theoretical and Experimental Probability Lesson Plan 7th Grade

Discussion/Introduction

Probability is the study of what will “probably” happen based upon a mathematical perception of “chance”. For this lesson, we will be doing some foundational thinking using independent events to compare and contrast theoretical and experimental probability.

Objective

  • Students will be able to find the theoretical probability of an event and then test it against an example of experimental probability.
  • Students will be able to understand that the theoretical probability predictions should be closer to the actual experimental probability results as the number of trials increases.

Supplies

  • A coin
  • Theoretical Probability Worksheet (download printable)
  • Dice (1 for each student)
  • Calculators (optional)

Methodology/Procedure

  1. Bring up two students for a “gambling” opportunity. Ask each student to pick a side of the coin (heads or tails). Inform them that the first student to get 5 of their side (heads or tails) will be the winner. Ask the following questions before they start:
    1. How many flips of the coin do you think it will take before we have a winner?
    2. Does Student #1 have an equal chance of winning as Student #2?
    3. Can any of you summarize Student #1’s chance of winning? Student #2?
  2. Tally their data in a table such as this. Keep this table visible when doing steps 3 and 4 (to compare and contrast).
Student #1’s Name Heads
Student #2’s Name Tails
  1. Bring up a second partnership to flip coins. Inform them that the first student to get 10 of their side (heads or tails) will be the winner. Ask the same questions used before.
  2. Tally their data in a table just like you did with Step 2.
  3. Ask the following post-coin flip questions (they may need to be altered depending on how the “coin flipping battles” went):
    1. Why did it not take exactly 9 coin tosses to get a winner in our first battle?
    2. Why did it not take exactly 19 coin tosses to get a winner in our second battle?
    3. If I flipped a head the first time, does that mean that I will always flip a tail the next time? Am I more likely to flip a head if I just flipped a head?
    4. What was my probability of flipping a head each coin toss?
    5. What was my probability of flipping a tail each coin toss?
  4. Bring up two more volunteers. This time bring out a die (singular of dice). Do “rock, paper, scissors” to decide who gets to be the student that gets the factors of 6 and who gets to be the student that gets the non-factors of 6. They will have very different probability. Whenever one of their numbers is rolled, they get a tally mark. The winner has 10 tally marks.
    1. How many rolls of the die do you think it will take before we have a winner?
    2. Does Student #1 have an equal chance of winning as Student #2?
    3. Can any of you summarize Student #1’s chance of winning? Student #2?
  5. Tally their data in a table such as this.
Student #1’s Name Factors of 6 (1, 2, 3, 6)
Student #2’s Name Non-Factors of 6 (4, 5)
  1. Discuss this die rolling example.
    1. Were we close in our prediction of how many rolls we thought it would take?
    2. What was Student 1’s probability of winning written as a percent? (a great opportunity to show how to convert to percents)
    3. What percent of the rolls did Student 1 have? (a great opportunity to show how to convert to percents)
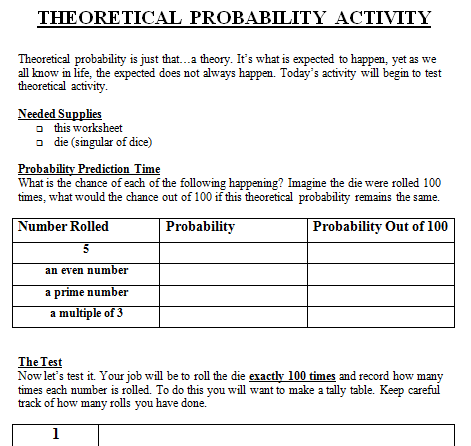
  2. Hand out the Theoretical Probability Worksheet and a die (singular of dice) to each student. Explain the worksheet to the students. Here’s an image of part of the worksheet.probability worksheet
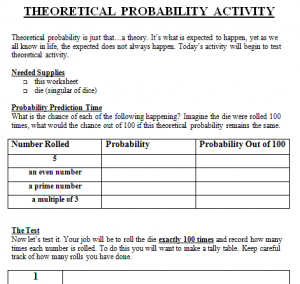
  3. Fill in the “Probability Prediction Time” section with the students. Teach the students how to tally in groups of 5 (this will be new to some). The biggest challenge in this activity is having students roll the dice exactly 100 times. You may want to put them into partnerships instead. In this case, one student keeps track of the number of rolls while the other student tallies his/her results. Then switch so that each student has his/her own unique data. If you are not using partners, really stress to the students that they will want to organize their total number of rolls somehow (either through tallying on their own) or stopping to count their progress regularly throughout. Each student needs exactly 100 rolls for this to be highly successful. Have the students complete “The Test” section of the worksheet.
    1. Note: This will get loud as students roll. I usually give about 5-10 minutes for the actual 100 rolls and tallying time. If you are using partners to help with counting the rolls, then double the time needed.
  4. As a class, complete the “Comparing Theory with Reality” section of the worksheet. Students may need help turning their fractions into percents for the “Probability Out of 100” column. You may opt to let them use calculators.
  5. Have students independently answer the “Critical Thinking” questions.
  6. As a good follow up, you can choose one of the categories (i.e. multiples of 3) and come up with a class total for this to show that the greater the number of trials, the closer the experimental probability results come to the theoretical probability predictions. To do this, you would find the sum of all multiples of 3 (as an example) for the class. You can do this more efficiently by collecting class table sums. Then take this sum and divide it by 100 times the number of students in this class (the total number of rolls for the class). This will give you a decimal number that you can convert to a percent. It should be fairly close to the theoretical probability predicted percent.
  7. If time allows, you can do this with the other categories to see how close your class was as a whole for each theoretical probability prediction.
Download Lesson Plan

Download Lesson Plan

Common Core Standards

CCSS.MATH.CONTENT.7.SP.C.6
Approximate the probability of a chance event by collecting data on the chance process that produces it and observing its long-run relative frequency, and predict the approximate relative frequency given the probability. For example, when rolling a number cube 600 times, predict that a 3 or 6 would be rolled roughly 200 times, but probably not exactly 200 times.

Multiplying Integers Lesson Plan 7th Grade

Discussion/Introduction

By the time students enter into 7th grade, they hopefully have a strong understanding of multiplication with whole numbers. This lesson introduces multiplication with all integers. I highly recommend spending some time on this concept before introducing multiplication with other negative rational numbers. I have successfully used this lesson with my highly supported math classes. The use of the values -13 through +13, which you will see later in this lesson, makes it obtainable for even those students that may struggle with their math facts.

In preparation for this lesson, I recommend spending some time with students reviewing basic multiplication facts and the reasoning behind multiplication. It is important for students to understand that multiplication is repeating addition.

Objective

  • Students will understand the rules for multiplying integers.
  • Students will be able to solve two term integer multiplication problems.

Supplies

  • Multiplying Integers Intro Packet
  • Multiplying Integers Worksheet (with bags of stones on it)
  • 26-52 (even number) playing cards for every partnership (or group of 3 depending on structuring of groups)

Methodology/Procedure

  1. Pass out the Multiplying Integers Intro Packet. Guide the students through the thinking process for Activities #1-4. Here is an image of part of the packet.Multiplying Integers Intro Image
  2. Discuss with the students that there are rules for multiplying and dividing integers. Here are a couple story lines to help the students remember. Really make them dramatic when you teach them.
    1. The married couple rules—An optimistic person (“I love life! Life is great!”) meets another optimistic person (“I love life too! The butterflies and the birds and everything are just so beautiful!”). Do you think their relationship might work out, that it might be positive? (Student response—yes.) Now imagine an extraordinarily negative person (“I hate life! Life is no good!”) meets another negative person (“I do not like life either! Let us complain about it together!”). Though they may complain about virtually everything, could their relationship still work out? Could it still be positive for them since they see the world in the same way? (Student response—yes.) Now imagine an extraordinarily positive person (“I love life! Life is great!”) meets an extraordinarily negative person (“I hate life! Life is no good!”). Do you think their relationship will work out? (Student answer—no.) No, it will be a negative thing.
    2. Consequences of one’s actions—When a good thing happens to a good person, that is good. When a good thing happens to a bad person, that is bad. When a bad thing happens to a good person, that is bad. When a bad thing happens to a bad person, that is good.
  3. After going through one of the story lines, teach the rules of multiplying integers and then complete Activity 5 in the Multiplying Integers Packet.
  4. For additional practice, or for another approach to understanding multiplication of integers, you may pass out and complete the Multiplying Integers Worksheet with the bags of stones on it. Here is the basic premise of this sheet and an image of part of the worksheet:
    1. Stones are either cold (-) or hot (+).
    2. You can either remove (-) or add (+) stones.
    3. When you remove (-) a cold (-) stone, the temperature goes up (+).
    4. When you remove (-) a hot (+) stone, the temperature goes down (-).
    5. When you add (+) a cold (-) stone, the temperature goes down (-).
    6. When you add (+) a hot (+) stone, the temperature goes up (+).Multiplying Integers Bag Image
  5. As a follow-up, independent practice activity, get students into groups of 2 (or 3 if your class struggles with math facts) for Multiplying Integers War. Pass out 26-52 cards to each group. Groups of 3 have one extra person that acts as the “judge” checking the accuracy of the math facts and may use a multiplication table and/or calculator. Here is how the game is played:
    1. Each player gets half of the well-shuffled deck.
    2. Cards are either red (negative) or black (positive). The cards have their face value except for A = 1, J = 11, Q = 12, and K = 13. That means you have the integers from -13 to + 13 in play (except for 0).
    3. The players flip over the top card on their deck at the same time. The student with the higher valued card gets to attempt the math fact. If the player gets the math fact (sign included) correct, he/she gets both cards. If the player misses the math fact (sign included), then his/her opponent gets both cards.
    4. If both players play the same card (color and value), then a war ensues and students lay down three face down cards each and then flip for a winner (playing as described above).
    5. If you have a 3rd person acting as the “judge”, I recommend changing players after 10-15 minutes. The “judge” will then challenge the student that had the most cards (or was winning) at the time of the switch.
  6. This activity can be followed up by standard multiplication of integers homework.
Download Lesson Plan

Download Lesson Plan


Common Core Standards

  • CCSS.MATH.CONTENT.7.NS.A.2
    Apply and extend previous understandings of multiplication and division and of fractions to multiply and divide rational numbers.

    • CCSS.MATH.CONTENT.7.NS.A.2.A
      Understand that multiplication is extended from fractions to rational numbers by requiring that operations continue to satisfy the properties of operations, particularly the distributive property, leading to products such as (-1)(-1) = 1 and the rules for multiplying signed numbers. Interpret products of rational numbers by describing real-world contexts.

Web Resources/Further Exploration

Multiplying and arithmetic games

Understanding Circumference and Area of a Circle Lesson Plan 7th Grade

Discussion/Introduction

This is the third lesson in a series on circles. It follows the Elements of a Circle Lesson Plan 7th Grade and the Understanding Pi Lesson Plan 7th Grade. When all three lessons are done, students should have a firm understanding of what makes a circle, what pi represents, and how to find the area and circumference of a circle. This lesson does require that students are comfortable with pi and does allow for differentiation and writing.

Objective

  • Students will understand that pi is the ratio .
  • Students will be able to find the area and circumference of a circle.
  • Students will understand the connection between the area of a square and the area of a circle.

Supplies

    • “The Ripple Effect” Worksheet
    • Calculators
    • Scissors (1 pair per group of 4)
    • Glue stick (1 per group of 4)
    • 3 different colored sheets of square paper (origami paper works well) per group of 4 students
    • “Area of a Circle” Worksheet
    • Student’s Circle Foldables from the last two sessions (started in Elements of a Circle Lesson Plan 7th Grade)

Methodology/Procedure

Understanding Circumference

  1. At this point, students should understand the following points. If this lesson is being done on a different day, I recommend reviewing these key points before beginning the day’s lessons. All information should be found on the students’ foldables.
    1. Circumference is the distance around a circle.
    2. The diameter is the distance across the circle, passing through the center.
    3. The radius is the distance from any point on the circle to the center.
    4. Diameter is two times the radius.
    5. Pi is the ratio .
    6. Pi can be approximated to 3.14.
  2. Get students into collaborative groups of 4 students and pass out “The Ripple Effect” Worksheet. Note that the first 2 pages are very guided. The numbers may require calculators yet it is still scaffolded. The last two pages may be used as either enrichment or as a follow up homework/family involvement assignment.
  3. Add the circumference information to the Circle Foldable.
  4. Homework/Review for this session can be a worksheet on circumference.

Understanding Area of a Circle

  1. Have students stay with their foursome from the previous activity.
  2. Pass out 3 congruent square sheets of paper in different colors to each group, a pair of scissors, and a glue stick.
  3. Have 1 student from the group fold one sheet in half and then in half again (“snowflake fold”). From this point, have the student cut the shape of a quarter circle. Be careful that they cut off the “open flap” side. This needs to be the biggest circle possible so the arc will go to both corners. Recommend that they really cut wide or the circle will be misshaped. You will want some extra sheets on hand. Glue this circle on top of the square with the folds horizontal and vertical. (Included is a sheet with images for the Square/Circle/Diamond Cut Outs.)
  4. Have another student fold the third sheet in half and then in half again (“snowflake fold”). From here have the student cut from one corner to its diagonal corner. Be careful that they cut off the “open flap” side. This should form a diamond/rhombus/square. Glue this diamond on top of the circle with the folds horizontal and vertical.
  5. Lead a short class discussion on the shapes and recap their properties.
  6. Have another student cut the large shape into four equal parts. Each student will get one part.
  7. As a class discussion, ask the following questions:
    1. What shape do we have on the bottom?
    2. If the square represents our whole, what fraction of the whole is the triangle? How do you know?
    3. Does the quarter circle have a greater or smaller area than the triangle? How do you know?
    4. Since the quarter circle has a greater area than the triangle, is it greater than or less than ½ of the area of the square?
    5. Does the quarter circle have a greater or smaller area than the square? How do you know?
    6. Since the quarter circle has a smaller area than the square, is it greater than or less than 1 of the area of the square?
    7. Can we put that into the form of a compound inequality? The quarter circle is greater than _________ of the square but less than __________ of the square.
  8. Pass out the “Area of a Circle” Worksheet: Have students work as a group on the first half. Lead a class discussion for the back side.
  9. As a summation for the day, have students add information about the area of the circle to their Circle Foldables.
  10. Homework/Review for this session can be a worksheet on the area of a circle.

adobe_pdf-116x150

Download Lesson and Printables


Common Core Standards

CCSS.MATH.CONTENT.7.G.B.4

  • Know the formulas for the area and circumference of a circle and use them to solve problems; give an informal derivation of the relationship between the circumference and area of a circle.

Addresses all 8 Standards for Mathematical Practice

Understanding Pi Lesson Plan 7th Grade

Discussion/Introduction

This is a second lesson on circles. If you feel as if your students need an initial lesson on radius and diameter , please refer to Elements of a Circle Lesson Plan 7th Grade  ; otherwise, this can be a standalone lesson if you are looking for a one-day hands-on activity. I like to follow it up with the lesson on Area and Circumference of a Circle to allow more practice and to embed opportunities for deeper reasoning about circles. When all three lessons are done, the entire 7th grade standard for circles is addressed.
Download Lesson Plan

Objective

  • Students will understand that pi is the ratio circumference: diameter.

Supplies

    • 1 traceable circular item (mug, lid, pot, etc.) per student (ideally -8 in diameter) (Students will be working in groups of 4-5 students. No member of a group should have the same sized item.)
    • A piece of yarn (2 ½ feet long) per student
    • Scissors
    • Glue sticks
    • 1 sheet of colored card stock or construction paper per student
    • A ruler that shows centimeters (Students may share but I recommend no more than 2 students per ruler.)
    • Calculators
    • “Investigation of Pi” Worksheet (available as part of the download with this lesson plan)
    • Student’s Circle Foldable from the Elements of a Circle Lesson Plan 7th Grade

Methodology/Procedure

  1. Break students into groups of 4-5 students. Pass out 4-5 (depending on group size) traceable circular items (lids, mugs, pots, etc.) to each group. To make resources easier, do not use items that have larger than an 8” diameter. Also pass out the “Investigation of Pi” Worksheet, a pair of scissors, and a length of yarn (a little longer than the circumference of the largest item) to each student.
  2. Have each student trace one of the items onto a colored sheet of paper or construction paper. They will then cut out their circle and fold it in half two times to approximate a center point. This will be necessary to find the diameter.
  3. From here they will use their length of yarn and wrap it around the item. They will then cut the yarn to the best of their ability to represent the distance around the item.
  4. They will then fill in the data for row #1 on their “Investigation of Pi” Worksheet. They will need a calculator.
  5. Have students rotate their worksheets allowing each student to fill in the data for each circle at the table. Students may find that they need to cut yarn pieces again, so have extra on hand.
  6. As a class, share out responses and observations.
  7. Have each student answer the questions on page 2 of the “Investigation of Pi” Worksheet. Stress the importance of responding in complete sentences.
  8. Give the class 10 minutes or so to assemble their circles into posters and to decorate them. They should attach their chart as evidence/justification to the circle.
  9. As a final summation of the day, have the students complete the next section (Pi) on their Circle Foldable from the Elements of a Circle Lesson Plan 7th Grade.

Here’s a snippet of the “Investigation of Pi” Worksheet that is available as part of this download. It also has a set of reflection questions on the back to help the students understand pi.

Investigation of Pi Screenshot


Download Lesson

adobe_pdf-116x150

Common Core Standards

CCSS.MATH.CONTENT.7.G.B.4

Know the formulas for the area and circumference of a circle and use them to solve problems; give an informal derivation of the relationship between the circumference and area of a circle.

Addresses all 8 Standards for Mathematical Practice

Elements of a Circle Lesson Plan 7th Grade

Download Lesson

Discussion/Introduction

Circles are an exciting and often confusing shape for middle school students to understand. This lesson is a prerequisite lesson to help students prepare for learning what pi is and how to find the circumference and area of a circle. .

Objective

Students will understand the defining elements of a circle and be able to find the radius and diameter of a circle.

Supplies

  • A small (no greater than 3 1/2 in diameter) circular item for tracing for each 1-2 students
  • 4 sheets of copy paper (or card stock if available) per student
  • 2 small sheets of colored paper (2 different colors) per student
  • 1 brad per student
  • Scissors (1 pair for every 1-4 students)
  • Staplers
  • Sticky notes


Methodology/Procedure

1. Ask students to form a large standing circle. From this position, collect students’ input on “how” they formed the circle and what a circle is. As students share out, have a class scribe (one of the students in the circle) write down their ideas on sticky notes. To deepen the understanding of what a circle is, remove one of the students from the “circle” and have him /her stand in the middle instead. Continue the class discussion on what a circle is until you have had 5-8 students to contribute their ideas.

  • Students may need a bit of support. The main ideas we are trying to get are as follows:
    • A circle is a series of points all equal distance away from a defined point (the center).
    • A circle is a continuous curve.
    • The circle is technically the space confined within the points.

2. Review students’ sticky notes.

3. Create a foldable on the parts of a circle. This foldable can either be a foldable just for this unit, or it can cover the 7th grade geometry unit (parallelograms, triangles, circles, and 3-d figures). Included in the lesson plan is a sample for the circle section filled in by the end of this 3-session lesson plan.

4. Give each student two small square sheets of paper in two different colors. Have the students trace the same small circular item (bottom of mug, jar lid, etc.) on each sheet of paper. Cut out both circles. You should now have two congruent circles. Fold both circles horizontally and vertically. Cut a slit to the center on each. Overlap the two circles. Pass out a brad to each student to make a rotatable circle.

Circle Lesson Plan Student Product

5. Complete the first half of the Circle Foldable (showing parts of a circle, characteristics of a circle, and some sample radius and diameter problems).

6. Homework/Review for this session can be a worksheet on radius and diameter.


adobe_pdf-116x150Download Lesson

Common Core Standards

CCSS.MATH.CONTENT.7.G.B.4

  • Know the formulas for the area and circumference of a circle and use them to solve problems; give an informal derivation of the relationship between the circumference and area of a circle.

Addresses all 8 Standards for Mathematical Practice