Data Representation and the Easter Bunny: 1st Grade Lesson

screenshot

Discussion/Introduction

We’ve just celebrated Easter, and it’s the perfect time for a lesson on data collection and representation! After all, how else could the Easter Bunny get all the information he needs to bring perfect Easter baskets to every household, if it weren’t for a bit of mathematical genius?

Objective

Students will learn how to organize data with up to three categories and represent it on a simple grid. They’ll learn to interpret such graphs, and practice writing statements  answering questions on data recorded.


Supplies

  • Bunny ears, if you want to be fun and go in character!
  • 1st Grade Data Representation Worksheet, one per student.

Methodology/Procedure

You want to start by giving your students the lay of the land. 1st graders like to know what’s what, and there are many children who learn better if they can see a ‘road map’, so to speak, of where they’re going and what they’re meant to do. So start with a discussion like this one:

There’s an enormous amount of information in the world, and part of our job as intelligent people is to gather that information, organize it so that it is in a way we can use, and interpret it. It comes to us like a big unorganized pile, and our job is to take this messy information and make it nice and neat and easy to use.

Today we get to learn how to do just that, and to make it extra fun, let’s start with as story. Can anyone tell me which holiday has just been (or is coming up)?

Easter!

Yes! And who comes to visit Easter morning, before you’ve even got up?

The Easter Bunny!

You’re right, it’s the Easter Bunny! He comes to bring yummy treats or special little presents, but he doesn’t bring the same thing to each house; somehow he needs to know what is the perfect Easter surprise for every little girl and boy.

How many little girls and boys does the Easter bunny visit?

Give your students a chance to discuss the numbers, as specifically or vaguely as they like. The take away point: Lots and lots!

Now put on your bunny ears: this is when the fun begins! You can get into character as much or as little as you like, depending on your personal teaching style; but the children will certainly appreciate you unbending a little and helping the pretend along with a few apt characterizations.

Let’s pretend I’m the Easter bunny, and pretend I have a bag full of special treats. I’ve got white chocolate eggs and brown chocolate eggs, and I’ve got some plastic eggs filled with other fun surprises for children whose parents don’t want them to get too much candy. Suppose that I have a little notebook, and well before Easter, I start making plans so that on the big day I’ll know what I have to deliver where. I could go hide in everyone’s back yard and listen till I found out what kind of surprise they’d prefer, but since we’re all in class now, I’ll just ask.

Starting with the front, ask the children which type of Easter surprise they would prefer: brown chocolate, white chocolate, or plastic eggs with little surprises. Write the information on the chalkboard in complete sentences, for instance “Leanna likes brown chocolate eggs best.” Go through six or seven children, and then stop and look at the board. Ask your students how much paper it would take for the Easter bunny to take notes on everyone he brought gifts to, and whether, when it was all written down, it would be easy for him to see how many brown chocolate eggs he needed and if he needed more plastic eggs than white chocolate eggs or more white chocolate than plastic eggs.

Give the students a chance to discuss this; the conclusion, if you’ve done it right, should be quite simple:this is messy and difficult! Talk about what might make it easy. Some ideas they might come up with are neater handwriting, or using different columns (or notebook pages) for each of the three categories.   Then tell your students you want to show them a super-easy way to write down information so it’s easy to look up after.

Draw a large rectangle, and divide it into three rows and two columns; your first column will be used for labels and can be much narrower than the second. In the first column, write the labels. “Prefers brown chocolate”, “Prefers white chocolate”, “Prefers plastic eggs “ Go through the class again, asking the same questions and noting names in the appropriate columns.

Tell them your columns are called a graph, and ask which way is easier to collect information: noting it in a graph, or writing about it? They should be pretty unanimous that the graph is easier.

What about if you need to know which to pack more of, white chocolate, brown chocolate, or plastic eggs? Show your students how they can find this information in a glance from the graph. Drawing it from the written record is time consuming and difficult.

Ask how many baskets with plastic eggs you would need if you were delivering Easter baskets to all the students in the class.

Now give the students the handout, and ask them what three types of surprises they’d want to bring if they were an Easter bunny with the power to bring gifts to all their class-mates. Guide them in filling out the first column, and have them survey the other students in the class, writing down the names in the appropriate rows.

Allow them to take turns showing their graph and sharing the information with the class. Ask which surprise most students preferred, which surprise fewer students were interested in, and how many students wanted a particular surprise. As an added exercise, you could have the students write three or four sentences describing their findings in their math journals. This will help cement the work they’ve done in class.

Common Core Standards

This lesson is aligned to the Common Core State Standards for Mathematics.  In 1.MD.4, The Common Core Standards read

1.MD.4 Organize, represent, and interpret data with up to three categories; ask and answer questions about the total number of data points, how many in each category, and how many more or less are in one category than in another.

Web Resources/Further Exploration

This lesson plan (available here  as a pdf download ) is only one in a series of engaging, fun math lesson plans coordinated to the Common Core and easy to use in the classroom. Browse through the other lessons at https://www.mathwarehouse.com/topic, and enjoy the wealth of other math resources available at Mathwarehouse.com


Other Resources

Fraction Visualizer


Simplify Fractions Calculator


Fraction Games


Simplify Fraction calculator
Fraction Calculator

4th Grade Fractions: Bringing Order to Disorder

hellomynameisscreenshot

Discussion/Introduction

Ordering: it’s one of the first math lessons in kindergarten, and it continues to be an important concept up through graduate school. Today, in your fourth grade math lesson, you’re going to be looking at ordering a set of numbers that may seem un-order-able to the uninitiated: dissimilar fractions.

What is the secret to ordering fractions who use mismatching names and don’t want to stand in line? Find out their other, secret names!

You’ll want to do this 4th grade fractions lesson after you’ve introduced equivalent fractions and given your students the tools to recognize and generate equivalent fractions. A free fourth grade lesson plan that covers those topics is available here. 

Objective

Your students will learn to compare two and more fractions with different numerators and different denominators. They’ll practice two different ways of doing this: 1) creating common denominators and numerators, and 2) comparing to a benchmark fraction such as ½.

Supplies

  • Name card holder pockets that can go around children’s necks
  • My Name Is Fraction Name Flashcards, Set 1 and 2 (Set 1 has just 16 cards if you have more students than this, print out multiples.)
  • Quick Quiz, one copy per student

Methodology/Procedure

Start on a positive note: today, we get to play a fun new game! Remember, if you have fun with this, your students will too, and there’s no better way to wire the brain for optimal learning than by making learning fun.

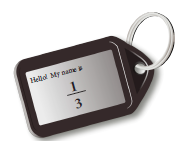
Hand out “My name is” fraction cards from your first stack to everyone in the class. Duplicates are not a problem. Have them insert the cards in the transparent pouches and hang them from their neck.. Explain that the fraction on this card is their name for the rest of the class; and that it will be especially important during a new game that is going to be played.

Use your cellphone or MP3 player to turn on some music, and tell the students to mill around or ‘dance’ while the music is on. As soon as the music is off, they need to line up in order of their fractions. If they’re super-fast, there might be a prize.

Play the music, turn it off, and give the students a small amount of time to make sense of their fractions and try to order themselves. Equivalent fractions stand share one place in the line (standing side by side) . You do not need to wait for them to be done before calling a halt.

Observe that it was pretty difficult, and ask why. If no-one brings it up, you can observe that though we’ve learned to order fractions with similar denominators or numerators—fractions where the division size or number of portions was equal– we never learned anything about how to order fractions where both the top and the bottom were different. These fraction names could just as well be in different languages; they simply don’t want to be compared!

If the fraction names are in different languages and so can’t be compared, what is one way we could compare them?

Allow your students discussion time to consider this problem. If they do not arrive at the solution, give it to them: Even if fractions can’t be easily compared in their current state, you can translate them into similar languages so they are comparable! Remind them that one quantity can be described by more than one fraction; and that these different fractions that refer to the same portion are called equivalent fractions. Ask them how they might find other versions of their fraction names.

[Note: if your students came up with the alternative method of ordering dissimilar fractions—comparing to a benchmark—validate their thinking, then go on to discuss creating common denominators and numerators as an alternative way. ]

Summarize their responses on the board, and review any bit that needs reviewing. Then invite them to the table at the front of the room, where you’ve created a big messy draw pile of all the remaining fractions. Give them some time to look through these cards and find their own equivalent fractions. Offer unobtrusive help to anyone who needs it.

When they’ve all got their cards, tell them you’re to play the game again, and ask them whether it will be easier this time. Lead the discussion round to the fact that equivalent fractions, being representations of the same quantity, stand in the same place on the number line. Demonstrate how students can order themselves easily by comparing the fractions, finding pairs with the same numerator or the same denominator, and choosing an order based on that.

Give everyone a chance to compare cards and order themselves, then applaud them on their work and return everyone to their seats. If they’ve made reasonable time, offer them a token prize.

Write your findings on the board: we can compare dissimilar fractions by renaming them as equivalent fractions with common denominators or numerators.

Now write 1/3 and ¾ on the board, and ask them if they can tell you quickly which is larger. Talk them through using ½ as a benchmark fraction—1/3 is smaller than ½ because 3 is larger than 2, and ¾ is larger than 2/4=1/2 because 3 is larger than 2. So since 1/3 is smaller than ½ and ¾ is larger, 1/3 is smaller than ¾. Ask which symbol you should put between the two fractions, and if necessary, offer a short review of >, =, and <.

Now collect all the flashcards—the pile of originals and the pile of new names—distribute original fractions again, and give the students another chance to collect their new names from the draw pile. Ordering should be faster this time. Be available to help anyone who is struggling.

Ask your students to take the Quick Quiz out and time themselves to see how fast they are able to order the fractions on that page.


Hand out “My name is” fraction cards from your first stack to everyone in the class. Duplicates are not a problem. Have them hang it from their necks in the name card holder pockets. Explain that the fraction on this card is their name for the rest of the class, and especially, for a new game that is going to be played

Use your cellphone or mp3 player to turn on some music, and tell the students to mill around or ‘dance’ while the music is on. As soon as the music is off, they need to line up in order of their fractions. If they’re super-fast, there might be a prize.

Play the music, turn it off, and give the students a small amount of time to make sense of their fractions and try to order themselves. You do not need to wait for them to be done before calling a halt.

Observe that it was pretty difficult, and ask why. If no-one brings it up, you can observe that though we’ve learned to order fractions with similar denominators or numerators—tops or bottoms that are the same—we never learned anything about how to order fractions where both the top and the bottom were different. These fractions speak different languages, almost, and don’t want to be compared!

If the fraction names are in different languages and so can’t be compared, what is one way we could compare them?

Translate them into similar languages so they are comparable! Remind them that one quantity can be described by more than one fraction; and that these different fractions that refer to the same portion are called equivalent fractions. Ask them how they might find other versions of their fraction names.

Summarize their responses on the board, and review any bit that needs reviewing. Then invite them to the table at the front of the room, where you’ve created a big messy draw pile of all the remaining fractions. Give them some time to look through these cards and find their own equivalent fractions. Offer unobtrusive help to anyone who needs it.

When they’ve all got their cards, tell them you’re to play the game again, and ask them whether it will be easier this time. Lead the discussion round to the fact that equivalent fractions, being the same number, stand in the same place on the number line. Demonstrate how students can order themselves easily by comparing the fractions, finding pairs with the same numerator or the same denominator, and choosing an order based on that.

Give everyone a chance to compare cards and order themselves, then applaud them on their work and return everyone to their seats. If they’ve made reasonable time, offer them a token prize.

Write your findings on the board: we can compare dissimilar fractions by renaming them as equivalent fractions with common denominators or numerators.

Now write 1/3 and ¾ on the board, and ask them if they can tell you quickly which is larger. Talk them through using ½ as a benchmark fraction—1/3 is smaller than ½ because 3 is larger than 2, and ¾ is larger than 2/4=1/2 because 3 is larger than 2. So since 1/3 is smaller than ½ and ¾ is larger, 1/3 is smaller than ¾. Ask which symbol you should put between the two fractions, and if necessary, offer a short review of >, =, and <.

Now collect all the flashcards—the pile of originals and the pile of new names—distribute original fractions again, and give the students another chance to collect their new names from the draw pile. Ordering should be faster this time. Be available to help anyone who is struggling.

Ask your students to take the Quick Quiz out and time themselves to see how fast they are able to order the fractions on that page.


Common Core Standards

In Fourth Grade Number and Operations—Fractions item 2, the Common Core State Standards for Mathematics reads:

4.NF.2 Compare two fractions with different numerators and different denominators, e.g., by creating common denominators or numerators, or by comparing to a benchmark fraction such as 1/2. Recognize that comparisons are valid only when the two fractions refer to the same whole. Record the results of comparisons with symbols >, =, or <, and justify the conclusions, e.g., by using a visual fraction model.

Web Resources/Further Exploration

This lesson plan (available here as a pdf download ) is only one in a series of engaging, fun math lesson plans coordinated to the Common Core and easy to use in the classroom. Browse through the other lessons at https://www.mathwarehouse.com/topic, and enjoy the wealth of other math resources available at Mathwarehouse.com


Other Resources

Fraction Visualizer


Simplify Fractions Calculator


Fraction Games


Simplify Fraction calculator
Fraction Calculator

4th Grade Lesson: Playing With Parts

WorksheetScreenshot

Discussion/Introduction

What do your students need to grasp to really understand fractions? Is there a short list of formulas they should memorize? Does it all come down to basic familiarity with algebra, and being able to simplify down? Not really.

If your students understand fractions visually—if they have a mental image that pops up in their head whenever they see a fraction on the page—they understand fractions. It’s that simple.

The focus of this lesson is a key formula your students need to understand in order to get further in fractions, but when translated into real life terms it is an extremely simple and obvious concept. If you divide a portion of a whole into a certain number (n) pieces, how many of them would you need in order to have the same amount as you did originally? N, of course!

That’s why this discovery-based lesson is focused on visual representations, and why you want to play with real-life fraction like oranges when introducing the concept. In this lesson you’ll also be having your students drawing, coloring, and superimposing so the idea can be really thoroughly cemented in their minds.


Objective

That students would be able to use visual fraction models, like oranges or drawings on paper, to explain why a fraction a/b is equivalent to a fraction (n x a)/(n x b), and that they would be able to use this idea to make their own lists of equivalent fractions or recognize equivalent fractions in a list.

Vocabulary: partition, equivalence, fractions,  reason, denominator, numerator.

Supplies

  • Index Cards
  • Crayons or colored pencils that can be used for shading.
  • Scissors
  • Orange (unpeeled, or unpeel it during the beginning of the lesson)
  • Worksheet (printable here)

Methodology/Procedure

Start with vocabulary, so you and your students will all be speaking the same language. Write the ‘wordlist’ out on the board, ask the students what each word means, and then summarize each definition after the word.

You’ll want to use these words throughout the lesson, but don’t assume your students have them memorized unless you have a good reason to believe so. The focus of this class isn’t words, and though precise mathematical speech will only be helpful in the future, there’s no reason to confuse students over terminology.

Now pick up your unpeeled orange. Tell your students you are going to partition this orange. What does that mean again? Yes, you’re going to divide it in parts!

Split the orange in half. How many parts did you partition it into? 2!

Ask a student to come and write a fraction describing one of those pieces on the board. He should have no trouble coming up with ½.

Ask him to divide it into half, and then write the fraction denoting one of the resulting pieces on the board. Then, ask him to denote a fraction denoting both of the resulting pieces. Walk him through any part of this he has trouble with. Don’t draw attention to the sameness of the fractions just yet; but if anyone discovers it on their own, acknowledge them and allow them to share their discovery with the class. Ask your demo student to sit down again.

Give each student four index cards. Ask him to divide the first one in half, and shade half. When this is done, go to the next. Ask him to draw the same line and partition it into half and then to make a crosswise line as well to partition once more. How big is each part? One fourth. Walk the students through partitioning the remaining cards into sixths and eighths.

When all the index cards are divided, ask your students to shade half of the first index card. Ask them to shade 2/4th of the second, 3/6th of the third, and 4/8th of the fourth. Write each number down on the board as you request it.

Then ask them to look at all the index cards and tell you if they can see any interesting patterns on them. It won’t be long before someone makes an important observation: they’re all the same!

Are the pieces the same size? No. Are the same number of pieces shaded? No. But the total amount shaded is the same on each card.

Now you want to draw everyone’s attention to the numbers on the board. Are these numbers the same? They don’t look the same. What is the same about them? Give them some time to discuss the problem with their neighbors and consider solutions.

If no-one can think of anything, suggest they dig down deeper by factoring each of the digits. Go through and write all four numbers on the board, factored, with help from the students. Then step back, look at it again, and ask them

“Does this help?”

It does, of course. Let them have as long as they want to discuss and think about it, and it won’t be long before someone discovers that they’ve all got ½ hiding inside of them—masked by some other numbers that – surprise— are equal on top or bottom. This is a very important discovery and should be treated as such. Allow the discoverers to describe the phenomena in their own words, and let them go as far as they feel comfortable with it. When they’ve done, give them this way to condense their findings:

a/b = (n x a) /(n x b) Look, this is what we’ve just discovered. A fraction is always equal to itself multiplied by the same number on both top and bottom.

Now ask your students if they can show you why this is true using their index cards and a pair of scissors. Make the first half cut on your index card, and observe this is ½. Ask how you can show multiplying the bottom by n (cutting each piece into n pieces). Ask how you can show multiplying on the top by n (taking n of the existing pieces).

If multiplying on the bottom is cutting into n pieces, and multiplying on the top is taking all n, it will be obvious why you get the same amount of material each way. If you have the same total amount—even if the pieces are different sizes, and even if there are a different number of pieces—you have ‘equivalent fractions’.

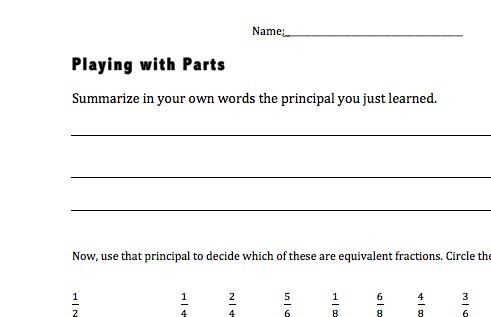
When they’ve demonstrated they understand the material, hand out the worksheets and give them some time to fill them out. Allow them to discuss the best way to summarize the principal in the first half of the worksheet, if desired.

Common Core Standards

In Fourth Grade Number and Operations—Fractions item 1, the Common Core State Standards for Mathematics reads:

4.NF. 1 Extend understanding of fraction equivalence and ordering.

Explain why a fraction a/b is equivalent to a fraction (n × a)/(n × b) by using visual fraction models, with attention to how the number and size of the parts differ even though the two fractions themselves are the same size. Use this principle to recognize and generate equivalent fractions.

Web Resources/Further Exploration

This lesson plan (available as a pdf download here) is only one in a series of engaging, fun math lesson plans coordinated to the Common Core and easy to use in the classroom. Browse through the other lessons at https://www.mathwarehouse.com/topic, and enjoy the wealth of other math resources available at Mathwarehouse.com


Other Resources

Fraction Visualizer


Simplify Fractions Calculator


Fraction Games


Simplify Fraction calculator

Fraction Calculator

3rd Grade Lesson: Fractions and Measuring

screenshot

Discussion/Introduction

Measuring Time! Time to get up, stretch, and have fun with some hands on stuff! Here we look at a combination of measuring—an exciting hands on subject for most gradeschoolers- with a real-life application of fractions. The concepts presented here are simple and your students shouldn’t have much trouble with them, but, done right, they will provide an invaluable intuitive understanding of fractional parts. In fact, this lesson might be considered a foundation stone for future work in three important fields: measurement, fractions, and data representation on line plots.

Objective

Students will learn to use the half and a quarter inch markings on their rulers: to take measurements down to half or quarter inches, to record their data appropriately, and to represent that data on line plots. This will also provide students with a visual representation of what fractions mean in real life.

Supplies

    • Rulers marked with halves and fourths of an inch
  • Fractions and Measuring Fun Worksheet (download printable)


Methodology/Procedure

Start out by asking your students what they know about fractions. Using their suggestions, make a bullet-list definition/description on the board. If they’re out of ideas, help them. Take time to elucidate any concepts they are hazy on; this is your chance to get everyone started on the same page.

Your list may look something like this:

  • Represent parts of a whole
  • Are written like a/b, when the whole is divided into b sections and there are a of those sections
  • Can be added together if the bottoms [denominators] are the same, by adding the tops [numerators]
  • A bigger bottom means a smaller amount, a bigger top means a larger amount

Once you’ve gone through what they’ve learned about fractions, tell them that this lesson we aren’t going to learn anything new about fractions. Instead, we get to use what we’ve already learned in a measuring lesson. Ask them to start by getting out their rulers and measuring their middle finger.

They are likely to begin by rounding up or down, so when you get your first data points you’ll want to challenge that and ask them to be more specific. It might go something like this:

Student: My middle finger is 2 inches!

Teacher: Is it exactly 2 inches, or a little more or a little less?

Student: It’s a little less.

Teacher: Do you see some other marks on your ruler? Those are fractions. Today I want us to learn how to measure more exactly, using those fraction markings.

On the board, draw an oversized ruler going from one to three inches. Mark halves and fourths of an inch. Draw an object alongside the ruler; you might make it 1 ½ inches long.

Teacher: This fork I just drew here is a little over one inch long, but if I want to be exact, I have to look at the little markings on the ruler. Since this space (point out the space between 1 and 2) is one inch long, how much is this space? (shade the first half)

A Student: ½!

Teacher: Yes, the shaded area is half of the area between one and two, so this mark here is the half mark. So if my little fork reaches this mark, we say it is one and a half inches long.

Erase your shading, and shade the area between 1 and 1 ¼.

Teacher: Now how much of the area between one and two is shaded?

A student: ¼!

You’re right! So if I have a little tiny pencil that reaches just to here (draw your pencil on the board) it’ll be exactly 1 ¼ inch long.

Follow the same procedure to elucidate 1 ¾. Then draw a number of objects along your chalkboard ruler and get the students to label the lengths.

When they have a good grasp of these chalkboard measurements, go back to the thumb problem and list the middle finger measurements they give you.

When you’ve got the list down, draw a line plot on the board (a number line) and place an x to represent each child’s thumb measurement. This will make it easy to see the clusters. Discuss the graph, and pose a few questions:

  • How many middle fingers are two and a quarter inches long?
  • Are most of the middle fingers in our class the same length?
  • How many middle fingers are longer than [choose a median value]?

Erase the board, draw a second line plot, and have the children measure their pencils, then take turns coming up to he front, noting down their measurement, and filling out an x on the graph.

Now, give your students the worksheet. Ask them to start by measuring all the items in their desk and writing them down on a list. Pencils, erasers, notebooks, textbooks and pencil cases are some of the items that might be measured and recorded. Then, they should fill in the numbers on the line plot and mark it appropriately.

Common Core Standards

This lesson plan is aligned with the Common Core Standards for Mathematics. In Grade 3, Measurement and Data, section 4, the Standards read:

3.MD.4 Generate measurement data by measuring lengths using rulers marked with halves and fourths of an inch. Show the data by making a line plot, where the horizontal scale is marked off in appropriate units— whole numbers, halves, or quarters.

Web Resources/Further Exploration

Math Warehouse is a treasure trove of resources for the math teacher. You’ll find a large bank of high quality free lesson plans, all aligned with the common core, and a variety of helpful tools to make teaching easier.

For instance, to make number lines like those in the worksheet you can use our Number Line Maker : it creates custom number lines as images you can download.

4th Grade Christmas Lesson: Measurement Conversion

ElvenMagicScreenShot

Discussion/Introduction

Time for a Christmas lesson! Tis the season to be jolly—and what is jollier than measuring fun with Santa’s Christmas Elves? Measurement is a huge topic in fourth grade. You’ll see your students move from the measuring and recording they did in previous years to something much more involved: manipulating data measurements and switching between units. Is that fun? Well, it can be! Taking your whole class on a journey to the North Pole workrooms is one magically fun way to give your students a first look at how data conversions work in the (almost) real world.


Because it’s important a fourth grade Christmas lesson be engaging. During the days before Christmas break your students’ interest will caught by what is happening outside the classroom, and it’ll be hard to get them to concentrate on dry facts and ordinary problem solving. That’s when a lesson like this one comes in particularly useful—a fun and engaging story lesson that will make even your most listless fourth grader sit up and pay attention.

Math isn’t optional in Santa’s workshops. Here the ability to switch between larger and smaller units describing the same material is essential to bring understanding between the elves who work in the inner courts, mixing and measuring, with the ‘outer regions’ elves who are responsible for bringing in raw material and calculating delivery details.

Objective

Students will learn to convert from larger measurement data to data in smaller units (hours to minutes, pounds to ounces, ), and be able to make tables of measurement equivalents that give them data which can be read in either direction (large à small or small à large)

Supplies

  • 1 “Elf Magic” worksheet for each student (download printable)

Methodology/Procedure

Get your students’ attention by beginning with a story. Start like this:

Christmas is approaching, and the activity in Santa’s North Pole workrooms ramps up day by day.

Some elves are busy in the inner chambers of Santa’s workshop. They’re doing delicate work that musn’t be interrupted, and during the month of December they’ll work from morning to night. Hazelnuts and ginger nuts, brought in by the North Post doves, are all they get to eat while on the job; and the cold glacial water keeps them awake and alert.  

Another group of elves has a very different job: scouring the earth for the raw material that Christmas treats are made of. These elves are nimble on their feet, and they’re able to climb down mountains, shinny down caves, or scrumble through jungles looking for whatever might be needed out in Santa’s workshop. Some even go on galactic missions, with a little help from Santa’s flying reindeer.

There’s only one problem, and that has to do with the language the different groups of elves use. The outer elves measure their raw material with large measurements—kilograms, pounds, meters and feet. If they talk about time, they talk about hours. The inner elves are much more precise. Instead of kilograms, they do their work with grams. They use ounces instead of pounds; and measure with centimeters or inches instead of meters and feet. When they talk time, it’s minutes or seconds.

That’s why there are conversion tables posted on the walls in the areas of Santa’s workshop where inner and outer elves meet. These are lists which interpret one measurement in terms of the other. Our job today is to help out the elves by making some of these conversion tables. 

The first elf we’re going to help out is a clever little fellow called Crusel. He’s in charge of a candy making room, and he spends his days making and tasting extra-wonderful candy for children that are marked down in Santa’s book as extra-special. Just now he is focusing on candy-canes. Pure white sugar, bright crimson coloring, and delicious peppermint oils are all brought to him by Ranger Elves; and since they measure in pounds and he only knows ounces, he needs a conversion table posted by his door to make ordering his ingredients straightforward and easy.

Does anyone remember how many ounces went in one pound? Yes, 16!

Prepare a two column table on the board; with ‘pounds’ and ‘ounces’ as the headings for the two columns. Write down 1 and 16 as the first row in the table. Then write 2 down underneath 1.

If Morwel, a ranger elf, brings in 2 lbs of crimson color, what will that be in ounces? Wait for an answer; if there is none; explain it:

1 lb was 16, so 2 lb will be 16+16, or twice 16.

Go on to three, four, five, and six, asking the class to provide the answers and the reasoning behind it, and filling in the table as you go. If you feel your students need the practice, you can continue the table up to ten.

Now, if he needs 64 ounces of crimson color, how many pounds must he request?

This should be easy for your students; if not, walk them through the reasoning behind the problem. Then go on: 

Orlian, in a little underground chamber, uses fresh milk and butter along with flavorful cocoa powder and crystal sugar to produce delicious Christmas chocolate. He likes to do all his measurements in milliliters; using a set of glass measurement cups and beakers his elf grandmother left him, but the elves that bring him his ingredients don’t like to deal with anything smaller than liters. Can you make a conversion table for his door, so he’ll know how many liters to request when he’s got an order—in milliliters—ready in his head?

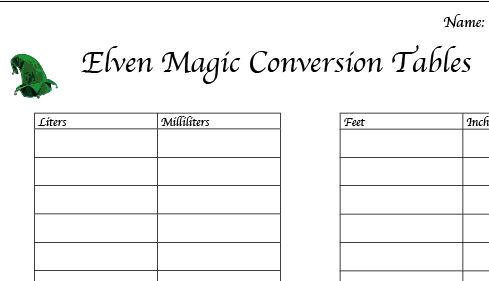
Pass out the worksheet, and guide your students into filling out the first two squares. Then give them a few minutes to fill out the rest of the table, walking around the room to help anyone that needs help.

When they’ve filled it out, ask—

  • Looking at your table, can you tell me how Orlian will request 4000 milliliters of fresh yellow butter?
  • How will Orlian request 5000 milliliters of good new milk?
  • If the outside elves brought him 7 liters of crystal sugar, how many milliliters would he have ready to use in his recipes?

There’s one more workshop I’d like us to visit today. Here Kruskru the elf is hard at working making sleighs for little boys and girls to play in the snow with. His ruler is in centimeters and inches, but the elves who bring him his wood and steel only have rulers that measure in feet and meters. Can you fill out this next table to help him convert between feet and inches? Start with one foot—does everyone remember how many inches that is?

Very good, twelve! So one foot in the first box, and twelve inches in the next. Now go to the next line, write ‘2’ under feet, and write down the number of inches in two feet in the next box.

Give your students some time to complete their tables, and, if class size permits, glance over their work when they are finished.

When students have filled out their tables, ask them:

  • If Kruskru wants a 24 inch piece of wood, how many feet will he ask for?
  • If a woodcutter elf brings Kruskru a seven foot piece of wood, how many inches long will it be?

If you have extra time, stage some play acting. Let half of your students be workshop elves, and the other half rangers. Pair them up, and give them each dimensions to work with: gallons and quarts, ounces to pounds, seconds to minutes. Let the pairs work together to make conversion tables or let them work together in larger groups if there is less time. Then set a few problems to each pair/group.

Common Core Standards

This lesson is aligned to standard 4.MD.1 in the Common Core State Standards for Mathematics; 4th Grade Measurement and Data Item 1. 4.MD1 reads:

Solve problems involving measurement and conversion of measurements from a larger unit to a smaller unit.

Know relative sizes of measurement units within one system of units including km, m, cm; kg, g; lb, oz.; l, ml; hr, min, sec. Within a single system of measurement, express measurements in a larger unit in terms of a smaller unit. Record measurement equivalents in a two- column table. For example, know that 1 ft is 12 times as long as 1 in. Express the length of a 4 ft snake as 48 in. Generate a conversion table for feet and inches listing the number pairs (1, 12), (2, 24), (3, 36), …

Web Resources/Further Exploration

This is just one of many lesson plans available on Mathwarehouse.com, your new favorite website for lesson preparation. You’ll also find a host of other math teaching resources, like our Visual Fraction applet for those fraction lessons or the handy grapher for when you and your students dig into graphs of all times.

3rd Grade Lesson: Number Names and Fraction Comparisons

Worksheet Snapshot

Worksheet Snapshot

fractioncomparisions_snapshot


Discussion/Introduction

Many 2nd graders and early 3rd graders will consider fractions and whole numbers to be entirely different animals. A fraction is a fraction; a piece of a pie, a portion of a square. A whole number is something other; an indivisible round, an atomic whole.

But third grade is the time when children come to terms with the continuity between fractions and whole numbers. That there are fractions which are simply ‘names’ of whole numbers will surprise some of your students, but it will be a good surprise that can open the doors into future ease in fractional manipulation.

This lesson also builds on the concept of ordering fractions, a topic that is introduced in a previous MathWarehouse lesson. You want your students to become fluent at comparing the landscape of ‘fraction land’. Your aim is that they would be able to tell you on sight which is the greatest of two fractions, given either a similar denominator or a similar numerator.

Objective

That students would be comfortable relating fractions and whole numbers, going from fractions to whole numbers and back again. That they would also gain familiarity in ordering fractions and comparing the sizes of any fractions that have either the same numerator or the same denominator. (3.NF.3.c &d)

Supplies

  • Number Names Worksheet (download printable)
  • Fraction Comparisons Worksheet (download printable)

Methodology/Procedure

Draw a half circle on the board, and ask your student if they can tell you some of its names. If they’ve been exposed to ‘fraction names’ in Mathwarehouse’s Discovering Equivalence lesson plan, they should be able to help you come up with a long list as they mentally divide the circle into more and more segments: ½, 2/4, ¾.

Now draw another circle on the board and shade the whole thing. Ask your students if they know the names of this portion. Write ‘1’, beside the circle, and wait for more suggestions.

If a student comes up with 2/2 for a suggestion, draw the dividing line, tell him he’s right, and put the fraction down on your list. Encourage your students to continue mentally dividing the filled circle to create more fractions. Once you have a long list, ask them how much longer they think it will be. Discuss how it is a list that can go on forever, because you can always divide every portion into smaller and smaller portions. The numbers on the top and bottom of your fractions—always the same—will just keep on getting larger and larger and larger, and there is no end.

Now tell your students you have a very long list of numbers; suggest you put them all on a numberline. Draw a large numberline on the board and write on designations from one to ten, leaving room for continued expansion on the right. Ask for volunteers to come up and write the fractions on the numberline.

This is, in a way, a trick question; because the way the question is set up assumes that the names are separate numbers and will go to different points. If your students are awake and used to thinking through problems rather than parroting answers you should have at least one willing to challenge your statement: pointing out that the list is not a list of numbers, but a list of names of one single number. If anyone makes this objection, ask him or her to get up and demonstrate this to the class. This can be done by dividing the area between 0 and 1 into two portions, and counting down both of them for 2/2; dividing the area into three portions, and counting down all three for 3/3, and so forth.

If no one objects to the graphing of the ‘numbers’ give chalk to three or four volunteers and divide the list up between them, asking them to mark each of those numbers on the number line. They may stare at the board confusedly, they may begin marking the integers they see on the numerators, they may try to do fancy calculations, or they may all dash for the point ‘1’. Give them the time they need to think through the problem and make mistakes, and only call a halt on the project once they tell you they have the numbers all marked. Then, give appropriate feedback: if they’ve marked it correctly, tell them so, and ask them to explain to the rest of the class why all those points are one point. If they have marked the ‘numbers’ on separate points, ask them to demonstrate their ‘orderings’ with pictures.

It is important that you give them the time they need to discover the locations of these ‘cognates of 1’ on the number line, by whatever circuitous route they take. They will learn much more by making mistakes and following through to the dead ends that follow—and then rethinking the problem and finding the right answer—then they would if they were given the correct interpretation straight off. The circuitous, labored path will also cement the final concept in their minds in a way you’d never have been able to teach if you were the prime mover.

When your volunteer discoverers have come to the conclusion that every one of the ‘numbers’ is one, follow up on the concept of equivalence. Ask if these numbers are really one and the same quantity, or if each is just a little bit different. Agree with them that they are all equivalent; all different names of the same absolute point. Each name is just as true and accurate as any other, and no name is bigger or smaller than any other name.


Now you need to extend this to other numbers. Write 2 on the board, draw two circles, fully shaded, and tell your students “This is 2, and this is its name, 2. Does it have any other names?”

If your students have immediate suggestions, begin writing them down, illustrating with dividing lines drawn through your circles to allow any slower students to follow. If there are no suggestions, ask your students what would happen if you divide each circle in half. Allow them to take it from there, and write their list of the ‘names of two’ on the blackboard.

Give each student a copy of the Number Names worksheet, and encourage them to make their list of names for 3 and 4 as long as they can. If they have difficulty keeping track of multiple lines on their strawberry cakes, encourage them to draw their own sets of three or four circles and make the divisions on separate pictures.


This next part of this lesson plan can be taught as a separate lesson if your students go slowly through the whole number section. Remember, going slowly is not necessarily a bad thing; it may mean your students really are taking the time to think things through and really cementing these concepts in their minds.

Write two fractions down on the board: 2/3 and 2/4. Tell your students these are portions of two different regular sized snickers bar at your house, and ask them which is larger.

When they tell you 2/3 is larger, write that down using a > symbol. Ask them how they knew. Bring them to observe that the fewer pieces you divide something in, the larger the pieces are; and a third is larger than a fourth. Note that since the numerators are the same, the denominators will tell which is larger; and the smaller the denominator, the larger the portion.

Ask them how you could check this. One way would be laying the two snicker bar portions side by side. Since the snicker bars are somewhere else and that isn’t possible, you can also check by drawing diagrams, being careful to make neat thirds and quarters. Draw a visual fraction model and shade the areas, demonstrating that 2/3 is larger than 2/4.

Now write 2/3 and 2/4 on the blackboard again. Tell your students that this time, these are not snicker bars, but cakes. After the 2/3, write Mollie’s birthday cake. After the 2/4, write Jennie Brown’s cake. Ask which is larger.

After your students have answered, draw the cakes. Tell them Mollie’s cake is a 12” square. Tell them Jennie Brown’s cake is a three layer wedding cake, with a radius of 22”. Ask them if their answer is still right .

Ask them what went wrong in their thinking; or why the method they used for comparing parts of snicker bars didn’t work for comparing parts of cake. Bring them to observe that you can only compare fractions if they refer to identical wholes.

Let them know, though, that when they see fractions without designation in math problems, they may assume they are referring to identical wholes unless told differently. In story problems, though, they’ll need to be careful.

Now write 2/4 and ¾ on the board, and tell your students these fractions refer to snickers bars again. Ask which is larger. When they tell you ¾ is larger, draw the < symbol between the fractions. Ask how they knew. Bring them to observe that if the denominators are the same, the fraction with the larger number in the numerator is larger. This is because the identical denominator means the pieces are the same size, and the larger numerator means you have more pieces.

Ask them how they could check this: with a picture. Draw the picture, demonstrating that ¾ is a larger piece.

Now write ½ and 2/4 on the blackboard. Ask which is larger. Observe this is more difficult to compare by looking at the numbers because neither the numerator or denominator are the same, but ask them if they can rename ½ into something else. Suggest they draw a diagram of ½, and divide each portion in half again to find the ‘new name’. When they rename ½ as 2/4, the denominators become the same so that they can be compared easily: in fact,  the two fractions are both 2/4, exactly the same.

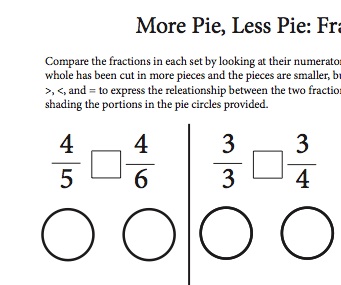
Give your students the fraction comparisons worksheet, and ask them to fill it out. They’ll be asked to use the symbols >,<, and = when they compare fractions, and they’ll also be asked to justify their conclusions with a simple circle diagram, a visual fraction model.

Common Core Standards

This lesson is aligned to 3.NF.3 c & d in the Common Core State Standards for Mathematics.  3.NF.3 reads, in part:

c.  Express whole numbers as fractions, and recognize fractions that are equivalent to whole numbers. Examples: Express 3 in the form 3 = 3/1; recognize that 6/1 = 6; locate 4/4 and 1 at the same point of a number line diagram.

d. Compare two fractions with the same numerator or the same denominator by reasoning about their size. Recognize that comparisons are valid only when the two fractions refer to the same whole. Record the results of comparisons with the symbols >, =, or <, and justify the conclusions, e.g., by using a visual fraction model.

Web Resources/Further Exploration

This is only the beginning: your students need to cement their understanding of ordering and comparing fractions by doing lots of games and exercises. Take advantage of everything Mathwarehouse has to offer–all free— by visiting http://www.mathwarehouse.com/fractions/ and also looking through our lists of free lesson plans.

Theoretical and Experimental Probability Lesson Plan 7th Grade

Discussion/Introduction

Probability is the study of what will “probably” happen based upon a mathematical perception of “chance”. For this lesson, we will be doing some foundational thinking using independent events to compare and contrast theoretical and experimental probability.

Objective

  • Students will be able to find the theoretical probability of an event and then test it against an example of experimental probability.
  • Students will be able to understand that the theoretical probability predictions should be closer to the actual experimental probability results as the number of trials increases.

Supplies

  • A coin
  • Theoretical Probability Worksheet (download printable)
  • Dice (1 for each student)
  • Calculators (optional)

Methodology/Procedure

  1. Bring up two students for a “gambling” opportunity. Ask each student to pick a side of the coin (heads or tails). Inform them that the first student to get 5 of their side (heads or tails) will be the winner. Ask the following questions before they start:
    1. How many flips of the coin do you think it will take before we have a winner?
    2. Does Student #1 have an equal chance of winning as Student #2?
    3. Can any of you summarize Student #1’s chance of winning? Student #2?
  2. Tally their data in a table such as this. Keep this table visible when doing steps 3 and 4 (to compare and contrast).
Student #1’s Name Heads
Student #2’s Name Tails
  1. Bring up a second partnership to flip coins. Inform them that the first student to get 10 of their side (heads or tails) will be the winner. Ask the same questions used before.
  2. Tally their data in a table just like you did with Step 2.
  3. Ask the following post-coin flip questions (they may need to be altered depending on how the “coin flipping battles” went):
    1. Why did it not take exactly 9 coin tosses to get a winner in our first battle?
    2. Why did it not take exactly 19 coin tosses to get a winner in our second battle?
    3. If I flipped a head the first time, does that mean that I will always flip a tail the next time? Am I more likely to flip a head if I just flipped a head?
    4. What was my probability of flipping a head each coin toss?
    5. What was my probability of flipping a tail each coin toss?
  4. Bring up two more volunteers. This time bring out a die (singular of dice). Do “rock, paper, scissors” to decide who gets to be the student that gets the factors of 6 and who gets to be the student that gets the non-factors of 6. They will have very different probability. Whenever one of their numbers is rolled, they get a tally mark. The winner has 10 tally marks.
    1. How many rolls of the die do you think it will take before we have a winner?
    2. Does Student #1 have an equal chance of winning as Student #2?
    3. Can any of you summarize Student #1’s chance of winning? Student #2?
  5. Tally their data in a table such as this.
Student #1’s Name Factors of 6 (1, 2, 3, 6)
Student #2’s Name Non-Factors of 6 (4, 5)
  1. Discuss this die rolling example.
    1. Were we close in our prediction of how many rolls we thought it would take?
    2. What was Student 1’s probability of winning written as a percent? (a great opportunity to show how to convert to percents)
    3. What percent of the rolls did Student 1 have? (a great opportunity to show how to convert to percents)
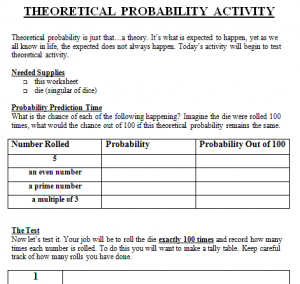
  2. Hand out the Theoretical Probability Worksheet and a die (singular of dice) to each student. Explain the worksheet to the students. Here’s an image of part of the worksheet.probability worksheet
  3. Fill in the “Probability Prediction Time” section with the students. Teach the students how to tally in groups of 5 (this will be new to some). The biggest challenge in this activity is having students roll the dice exactly 100 times. You may want to put them into partnerships instead. In this case, one student keeps track of the number of rolls while the other student tallies his/her results. Then switch so that each student has his/her own unique data. If you are not using partners, really stress to the students that they will want to organize their total number of rolls somehow (either through tallying on their own) or stopping to count their progress regularly throughout. Each student needs exactly 100 rolls for this to be highly successful. Have the students complete “The Test” section of the worksheet.
    1. Note: This will get loud as students roll. I usually give about 5-10 minutes for the actual 100 rolls and tallying time. If you are using partners to help with counting the rolls, then double the time needed.
  4. As a class, complete the “Comparing Theory with Reality” section of the worksheet. Students may need help turning their fractions into percents for the “Probability Out of 100” column. You may opt to let them use calculators.
  5. Have students independently answer the “Critical Thinking” questions.
  6. As a good follow up, you can choose one of the categories (i.e. multiples of 3) and come up with a class total for this to show that the greater the number of trials, the closer the experimental probability results come to the theoretical probability predictions. To do this, you would find the sum of all multiples of 3 (as an example) for the class. You can do this more efficiently by collecting class table sums. Then take this sum and divide it by 100 times the number of students in this class (the total number of rolls for the class). This will give you a decimal number that you can convert to a percent. It should be fairly close to the theoretical probability predicted percent.
  7. If time allows, you can do this with the other categories to see how close your class was as a whole for each theoretical probability prediction.
Download Lesson Plan

Download Lesson Plan

Common Core Standards

CCSS.MATH.CONTENT.7.SP.C.6
Approximate the probability of a chance event by collecting data on the chance process that produces it and observing its long-run relative frequency, and predict the approximate relative frequency given the probability. For example, when rolling a number cube 600 times, predict that a 3 or 6 would be rolled roughly 200 times, but probably not exactly 200 times.

3rd Grade Lesson Plan: Discovering Equivalence

Ordering flashcards

Ordering flashcards

Discussion/Introduction

What does it mean when a fraction is the same as another, and what does it mean when it is different? Is 2/4 really the same as ½? Although your students have discovered informally that the slab of pie represented by those two fractions— and the point on the number line—looks, feels, and acts the same, they still need to take this one step further and realize that these two fractions are actually one and the same quantity.

This 3rd grade lesson plan will give students the tools they need to understand  the concepts of same and different  applied to fractions. Through visual ordering exercises your students will become adept at recognizing fractions that are the same, and by the end of today’s session they should be able to make up their own simple lists of equivalent fractions.

Fractions and Ordering: Discovering Equivalence

It’s important that you introduce this topic with real world, dynamic, easily understandable examples rather than with mathematical equations and manipulations. Your students aren’t ready, right now, to grasp that 2/4 is ½ because they can divide 2 out of both sides of that first fraction. That is for later. Introduced with fancy manipulation, fractions become a complicated numerical puzzle that will leave many of your students feeling confused and helpless. When demonstrated with visual examples, though, equivalent fractions will speedily seem intuitive to your students; nothing less than common sense.

Objective

Students will understand that two fractions are equivalent if they are the same size, or the same point on a number line. They will be able to explain why fractions are equivalent, and will be able to recognize and make up lists of simple equivalent fractions.

Supplies

  • Folding paper, 1 square per student.
  • Flashcard sets; one per student (download printables)
  • 2 scrabble tile holders

Methodology/Procedure

As a warmup, begin with a quick fractions review. Pass out the folding paper, and have your students fold fractions—as fast as possible; first one done is the winner—as you call them out. Call out ½, 1/3, ¼, 1/6, and 1/8, in random order.

If they have difficulty, continue this exercise for several rounds. When they achieve fluency, tell them you are proud. Tell them you’ve got a fun topic to look at today; and it’s a topic you won’t even need to teach; they can discover it all themselves.   Give each student a partial set of fraction number & visual flashcards; ½, ¼, 2/4, and ¾ cards from both visual and numerical sets. Ask them to match the cards to the pie pictures, and then to order both sets according to size, smallest to largest.

When they have finished, walk around the room and review the students’ work. Help any who have had trouble, encouraging them to look at the picture cards and compare relative sizes. Find two students who have chosen different orderings, and give them the scrabble tile holders. Ask them to place their numerical cards carefully on the tile holder, then go to the front of the room and display their ordering to the class. Observe that these are two different orderings of the same set; ask which is wrong.

Invite any students who point out one or the other as wrong to explain why it is wrong, using the picture flashcards and comparing sizes.

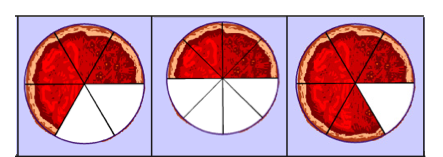
If your students say unanimously that neither is wrong, tell them that they are right. Draw on the board the visual circle fractions, and demonstrate how the two parts are exactly the same.

Tell them that in math the two fractions ½ and 2/4 are called equivalent fractions. Explain that what that means is that they are two names for the same thing. Sometimes one name is more useful, sometimes the other is. Ask them if they know anyone who has two names. If they do not come up with their own examples, remind them of a common acquaintance—the principal, perhaps, who is called Mr. Brown at school, Daddy at home, and Jake by his golfing friends. Point out that the man these names this refers to is the same, no matter what name he is called, and that all of these names belong to him equally.

You can also use yourself as an example.

Draw a half circle on the chalkboard, and tell your students this could be labeled as ½ or 2/4, and both answers would be entirely correct. Ask them if they can think of any other names for this same portion.

If any students have suggestions, invite them to come up and demonstrate equivalence on the board with pictures. If no-one has any idea, use lines to divide the circle on the board into eight equal wedges, and point out that half is also four 1/8 wedges, or 4/8.

Ask your students how many names each portion has. Let them think about and discuss this, and then demonstrate how each portion will have an infinite number of names, because you can always divide the existing pieces each in half again to get twice the amount of smaller pieces.

Hand out the remaining card sets, and ask the students to match the number cards to the visual cards and then order all the cards by portion size, from smallest to largest. Suggest they show equivalence by placing equivalent fractions at the same level in their orderings.

Let your students take their times over their orderings. If they finish quickly and you have time left before the end of the class, do some quiz work: draw shaded portions on the blackboard and ask your students to help you come up with a list of possible ‘names’.

Common Core Standards

This lesson is aligned to standard 3.NF.3 in the Common Core State Standards for Mathematics; 3rd Grade Numbers and Fractions item 3.  3.NF.3 reads, in part:

3.NF. 3. Explain equivalence of fractions in special cases, and compare fractions by reasoning about their size.

a. Understand two fractions as equivalent (equal) if they are the same size, or the same point on a number line.

b. Recognize and generate simple equivalent fractions, e.g., 1/2 = 2/4, 4/6 = 2/3. Explain why the fractions are equivalent, e.g., by using a visual fraction model.

Web Resources/Further Exploration

The beautiful flashcards  your students used in this lesson are made with the help of Mathwarehouse’s nifty Visual Fraction applet. This applet is a really fun way to generate classroom graphics, and also an enjoyable way for students who might be having difficulty visualizing fractions to see pizza portions generated before their eyes as they type in the fractions they are curious about.


adobe_pdf-116x150

Download this Lesson and Printables including Fraction Flash Cards


Multiplying Integers Lesson Plan 7th Grade

Discussion/Introduction

By the time students enter into 7th grade, they hopefully have a strong understanding of multiplication with whole numbers. This lesson introduces multiplication with all integers. I highly recommend spending some time on this concept before introducing multiplication with other negative rational numbers. I have successfully used this lesson with my highly supported math classes. The use of the values -13 through +13, which you will see later in this lesson, makes it obtainable for even those students that may struggle with their math facts.

In preparation for this lesson, I recommend spending some time with students reviewing basic multiplication facts and the reasoning behind multiplication. It is important for students to understand that multiplication is repeating addition.

Objective

  • Students will understand the rules for multiplying integers.
  • Students will be able to solve two term integer multiplication problems.

Supplies

  • Multiplying Integers Intro Packet
  • Multiplying Integers Worksheet (with bags of stones on it)
  • 26-52 (even number) playing cards for every partnership (or group of 3 depending on structuring of groups)

Methodology/Procedure

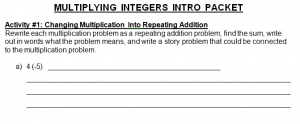
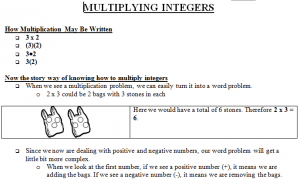
  1. Pass out the Multiplying Integers Intro Packet. Guide the students through the thinking process for Activities #1-4. Here is an image of part of the packet.Multiplying Integers Intro Image
  2. Discuss with the students that there are rules for multiplying and dividing integers. Here are a couple story lines to help the students remember. Really make them dramatic when you teach them.
    1. The married couple rules—An optimistic person (“I love life! Life is great!”) meets another optimistic person (“I love life too! The butterflies and the birds and everything are just so beautiful!”). Do you think their relationship might work out, that it might be positive? (Student response—yes.) Now imagine an extraordinarily negative person (“I hate life! Life is no good!”) meets another negative person (“I do not like life either! Let us complain about it together!”). Though they may complain about virtually everything, could their relationship still work out? Could it still be positive for them since they see the world in the same way? (Student response—yes.) Now imagine an extraordinarily positive person (“I love life! Life is great!”) meets an extraordinarily negative person (“I hate life! Life is no good!”). Do you think their relationship will work out? (Student answer—no.) No, it will be a negative thing.
    2. Consequences of one’s actions—When a good thing happens to a good person, that is good. When a good thing happens to a bad person, that is bad. When a bad thing happens to a good person, that is bad. When a bad thing happens to a bad person, that is good.
  3. After going through one of the story lines, teach the rules of multiplying integers and then complete Activity 5 in the Multiplying Integers Packet.
  4. For additional practice, or for another approach to understanding multiplication of integers, you may pass out and complete the Multiplying Integers Worksheet with the bags of stones on it. Here is the basic premise of this sheet and an image of part of the worksheet:
    1. Stones are either cold (-) or hot (+).
    2. You can either remove (-) or add (+) stones.
    3. When you remove (-) a cold (-) stone, the temperature goes up (+).
    4. When you remove (-) a hot (+) stone, the temperature goes down (-).
    5. When you add (+) a cold (-) stone, the temperature goes down (-).
    6. When you add (+) a hot (+) stone, the temperature goes up (+).Multiplying Integers Bag Image
  5. As a follow-up, independent practice activity, get students into groups of 2 (or 3 if your class struggles with math facts) for Multiplying Integers War. Pass out 26-52 cards to each group. Groups of 3 have one extra person that acts as the “judge” checking the accuracy of the math facts and may use a multiplication table and/or calculator. Here is how the game is played:
    1. Each player gets half of the well-shuffled deck.
    2. Cards are either red (negative) or black (positive). The cards have their face value except for A = 1, J = 11, Q = 12, and K = 13. That means you have the integers from -13 to + 13 in play (except for 0).
    3. The players flip over the top card on their deck at the same time. The student with the higher valued card gets to attempt the math fact. If the player gets the math fact (sign included) correct, he/she gets both cards. If the player misses the math fact (sign included), then his/her opponent gets both cards.
    4. If both players play the same card (color and value), then a war ensues and students lay down three face down cards each and then flip for a winner (playing as described above).
    5. If you have a 3rd person acting as the “judge”, I recommend changing players after 10-15 minutes. The “judge” will then challenge the student that had the most cards (or was winning) at the time of the switch.
  6. This activity can be followed up by standard multiplication of integers homework.
Download Lesson Plan

Download Lesson Plan


Common Core Standards

  • CCSS.MATH.CONTENT.7.NS.A.2
    Apply and extend previous understandings of multiplication and division and of fractions to multiply and divide rational numbers.

    • CCSS.MATH.CONTENT.7.NS.A.2.A
      Understand that multiplication is extended from fractions to rational numbers by requiring that operations continue to satisfy the properties of operations, particularly the distributive property, leading to products such as (-1)(-1) = 1 and the rules for multiplying signed numbers. Interpret products of rational numbers by describing real-world contexts.

Web Resources/Further Exploration

Multiplying and arithmetic games

Hopscotch Fractions: Third Grade Lesson Plan

faction-name-tag_lesson_prop

Fraction Name Tag


Discussion/Introduction

This lesson plan is meant to follow another; 3rd Grade Fractions on the Number line. These lessons are both aligned to Common Core Standard 3.NF.2. Here I’ll assume you’ve gone through that first lesson, and that your students are comfortable marking off intervals to show 1/b on the number line.

In your last lesson your students will have stayed in their chairs during most of the class period, working hard on dividing up fraction intervals and coming to terms with the idea that 1/b on a number line means portioning the interval between 0 and 1 into b parts and then, starting at zero, marking off one of these parts. Today you get to cement that concept a bit more by taking the next step up: your students will discover that a/b means that, starting at 0, you mentally hop a ‘1/b’ size steps toward 1.

That’s all they need to learn today, but you want them to know it backwards, forwards, and inside-out. Since there’s no better way to get to that point than with a fun de-stressing game, you’ll do this by getting your students up out of their chairs  for a rousing game of ‘hopscotch fractions’. Games have a way bringing book learning from the ‘theoretical’ category into ‘real life’, and this one is no exception.

Objective

That students would be comfortable representing a fraction a/b on a number line diagram by marking off a lengths 1/b from zero, and that they’d understand that the resulting interval has size a/b, and that its endpoint locates the number a/b on the number line.

Supplies

  • Large 0-2 number lines, laminated and taped to the floor (ideal length: 3 or 4 feet long). These can also be prepared by taping standard printing paper end to end and drawing the number lines with markers, using rulers for uniformity. You’ll need one for every four students.
  • Strips of colored paper the same size as one unit on the number line; one per student; four colors.
  • A marker for each student; four colors; each student’s marker must be coordinated with his paper.
  • Fraction Nametags (download printable)
  • Hopscotch Flashcards (download printable; print 1 per page)
  • Three types of stickers (ideally, small stars in red, yellow, or green; but other simple colored stickers can substitute).

Methodology/Procedure

Begin by reviewing what you taught in the last lesson. Remind the students that we talked about what fractions of abstract numbers mean, and we learned that they work in exactly the same way as fractions of tangible, concrete things like apples. Draw your 0-2 number line on the board, mark 0, 1, and 2, and ask how you would find out where to mark 1/3. After listening to their suggestions, take a  strip of paper the size of a unit on your number line, divide it in thirds, and use that to mark 1/3.

Then ask your students how you’d mark 2/3. Give them permission to discuss it with their neighbors, then ask for a volunteer to come and demonstrate it on the board. He will most likely demonstrate it correctly; laying your 1/3 strip end to end twice to find the 2/3 point.

If he doesn’t, or if the idea still seem counterintuitive to many of your students, go back to the idea of distance. Get a volunteer to come stand beside you and then walk three steps away. Ask him to come one third of the distance back (1 step). Then ask him to go back, and tell him now to come two thirds of the distance to you. Continue with other volunteers and other fractions until your students are comfortable with the idea.

Then transfer this idea onto your number line, and show how starting at zero and measuring two 1/3rds brings you to the 2/3 point on your number line.

Then have the children help you move tables and chairs to the back, so that you have a large empty space to work. If a gym or other large empty room is available, you may want to move there for the rest of this class. Otherwise, tailor the size of your number lines to match the available space.

Set up the number lines on the floor. Each number line will have four children manning it, so you’ll need to have as many number lines as the number of children in your class divided by four. These number lines will preferably be arranged side by side, in a line.

Assign the students to teams; four students to each number line. Give each student a strip of colored paper the size of one unit on their floor number lines. Then assign each student a fraction: in every group, you need a 1/3 student, a ¼ student, a 1/6 student, and a 1/8 student. Tape the designations on each student’s shirt. For a ‘handicapped race’ effect, give 1/3 and ¼ designations to the slower students, 1/6 and 1/8 designations to those that are faster. Each student will be called on the same number of times, but students with smaller fractions will have to do more counting and hopping.

Hand out the number strips and markers; in each group, one of each color. It helps organization if you give all students representing a particular fraction the same color.

If you have one odd student out, make him the caller. If you have two or three odd ones out, give them a number line and fractions.

Ask the students to mark where their fractions are on their number lines: 1/3, ¼, 1/6, and 1/8. They will do this with the strips of paper, folding them into appropriate sections as they did in yesterday’s lesson, and using those sections as rulers. Tell them to keep these strips of paper folded after they’ve used them. These strips are their ‘shoes’, and they’ll be needed again and again throughout the game.

Describe the game to them. The caller (you, if there wasn’t an extra student) stands at the front of the room with a pile of full-sized shuffled ‘hopscotch flashcards’. He picks one, displays it, and reads it out. Immediately the students representing that fraction take their ‘shoe’ – the paper strip—mark off the appropriate number of intervals, and then jump, once in each interval, to the fraction marker. For instance, if the caller picked “4/6” the 1/6 player would measure off 4 ‘1/6’ measures with his paper shoe, and then, as soon as they are measured, hop down to the fourth one, doing a one foot jump in each place. The first three to successfully measure and jump are awarded stickers on their fraction nametags: red for the first to hop to place, yellow for the second, and green for the third. Then they go back to the beginning, and the caller calls again.

They will soon discover that after they’ve been called once future calls are easier, as they will have marked off some (maybe all) of their fractions on the number line.  Since they are using their colored markers, it will be easy to tell their intervals versus their team-mates. Before the game is halfway done, you should have no measuring at all; just quick, sure hopping when a new fraction is called.

Throughout the game, continue to interweave your class objectives with the game by asking at intervals, randomly, but of every student at least once: How far did you jump? (a steps) What was the size of the interval you jumped through (a/b)? Where is the point a/b on the number line (at the end of a 1/b steps).

Play as long as time permits; the game speeds up as you go, so you should be able to get through the stack of flashcards twice. At the end of the game the stars get tallied up on a per team basis: red is three points, yellow two points, green one point. The team with the greatest number of points wins.

Common Core Standards

This lesson plan is aligned to the Common Core Standard 3.NF.2.  That item reads, in part:

3.NF.2. (b). Represent a fraction a/b on a number line diagram by marking off a lengths 1/b from 0. Recognize that the resulting interval has size a/b and that its endpoint locates the number a/b on the number line.

Web Resources/Further Exploration

This lesson plan gives you  one fun way of making fractions come alive, but it’s best to approach every topic from multiple angles. That’s why I’m recommending Mathwarehouse’s wonderful fraction resources again— after all, they’re all free!

adobe_pdf-116x150

Download Lesson Plan